CKD Stage, Modifiable Risk Factors,
and All-Cause Mortality in U.S. Adults
Time-to-event analysis of 5,038 NHANES participants linked to the National Death Index — identifying which factors truly drive survival after accounting for renal function
Background: Chronic kidney disease (CKD) affects an estimated 37 million U.S. adults and is a major predictor of cardiovascular and all-cause mortality.1,2 However, the relative contribution of renal function staging versus modifiable comorbidities — diabetes, poverty, physical activity — to mortality risk remains incompletely characterised in nationally representative samples.
Methods: We analysed 5,038 adults from NHANES cycles J (2017–2018) and L (2021–2023) linked to National Death Index mortality records (NCHS, 2023 release). CKD stage was defined using the CKD-EPI 2021 race-free creatinine equation and KDIGO 2024 G-staging.3,4 Multivariable Cox proportional hazards regression was fitted in three nested models. Model discrimination was assessed by Harrell's C-statistic, validated by 10-fold stratified cross-validation via tidymodels. Sensitivity analyses included multiple imputation (MICE, m=20), restricted cubic splines for eGFR dose-response, and cause-specific mortality analysis.
Results: Over median 2.1 years, 102 deaths occurred (2.0%). In the fully adjusted model (N=3,739; events=78), age per decade (HR 1.73, 95% CI 1.40–2.15, p<0.001) and diabetes (HR 1.73, 95% CI 1.03–2.90, p=0.038) were the dominant predictors. Economic hardship showed the strongest effect: below-poverty adults had 2.75-fold higher mortality risk (95% CI 1.18–6.37, p=0.019). CKD stage was not independently significant after adjustment, consistent with the 2.1-year median follow-up. BMI showed a counter-intuitive inverse association (obesity paradox). Full-model C=0.847; cross-validated C=0.810. Proportional hazards assumption satisfied globally (p=0.920).
Conclusions: In this nationally representative sample, age, diabetes, and income level — not CKD stage alone — are the dominant drivers of short-term mortality. Findings underscore the need for multi-domain risk assessment beyond renal function staging alone.
Introduction
Chronic kidney disease (CKD) is a silent epidemic: 37 million Americans live with reduced kidney function, yet fewer than 10% are aware of their diagnosis.1,5 CKD is classified by the Kidney Disease Improving Global Outcomes (KDIGO) framework into G-stages based on estimated glomerular filtration rate (eGFR) — ranging from G1 (normal, eGFR ≥90) through G5 (kidney failure, eGFR <15). Each stage carries progressively higher risk of progression to end-stage renal disease (ESRD) and premature mortality.
Yet CKD rarely exists in isolation. Most patients with CKD also carry diabetes (a leading cause of CKD), hypertension, cardiovascular disease, and socioeconomic disadvantage — all independent mortality predictors. A clinically important question is therefore: after accounting for these comorbidities, does CKD stage itself carry independent prognostic weight? And which modifiable factors offer the greatest leverage for intervention?
This analysis addresses these questions using NHANES 2017–2023 data linked to the National Death Index, applying modern survival analysis methods including cross-validated Cox regression, multiple imputation, and restricted cubic splines for dose-response assessment.
Data & Methods
2.1 Data source
Data were drawn from two completed NHANES cycles: J (2017–2018) and L (August 2021–2023). The 2019–2020 cycle (K) was suspended mid-collection due to COVID-19 and was never released. Mortality outcomes were ascertained via the NHANES Public Use Linked Mortality Files (NCHS, 2023), which link NHANES respondents to the National Death Index through December 31, 2019. XPT files were retrieved programmatically using the nhanesA R package and parsed using the haven library.
2.2 Renal function classification
eGFR was calculated using the CKD-EPI 2021 race-free creatinine equation, consistent with current KDIGO 2024 guidelines and clinical laboratory standards.3,4 CKD stage was assigned using KDIGO G-categories (G1–G5). UACR (urine albumin-to-creatinine ratio) was log-transformed for modelling to handle right skew.
2.3 Statistical approach
| Stage | Method | Package |
|---|---|---|
| Descriptive statistics | Table 1 stratified by CKD status | gtsummary |
| Survival visualisation | Kaplan–Meier curves by CKD stage | survminer |
| Primary inference | Multivariable Cox proportional hazards (3 nested models) | survival |
| PH assumption | Schoenfeld residuals, global and per-variable tests | survival |
| Functional form | Martingale residuals; restricted cubic splines (3 knots) | rms |
| Model discrimination | Harrell's C-statistic + 10-fold stratified CV | tidymodels + censored |
| Missing data | Multiple imputation by chained equations (m=20, maxit=10) | mice |
| Sensitivity | Cause-specific Cox, subgroup forest plots, eGFR threshold sensitivity | survival |
Cohort Profile
3.1 Inclusion / exclusion flow
3.2 Sample characteristics
| Characteristic | Value | Notes |
|---|---|---|
| Total participants | 5,038 | NHANES J + L cycles |
| Deaths (events) | 102 (2.0%) | Median follow-up: 2.1 years |
| Median age | 52 years | Range 18–80 |
| Median eGFR | 97.3 mL/min/1.73m² | CKD-EPI 2021 race-free |
| CKD prevalence (eGFR <60) | 8.5% | KDIGO stages G3–G5 |
| Diabetes prevalence | 18.8% | HbA1c ≥6.5% or diagnosis |
| Hypertension prevalence | 36.5% | Questionnaire-based |
| NH White / NH Black / Hispanic | 35% / 22% / 24% | NHANES race/ethnicity categories |
3.2b eGFR distribution across the cohort
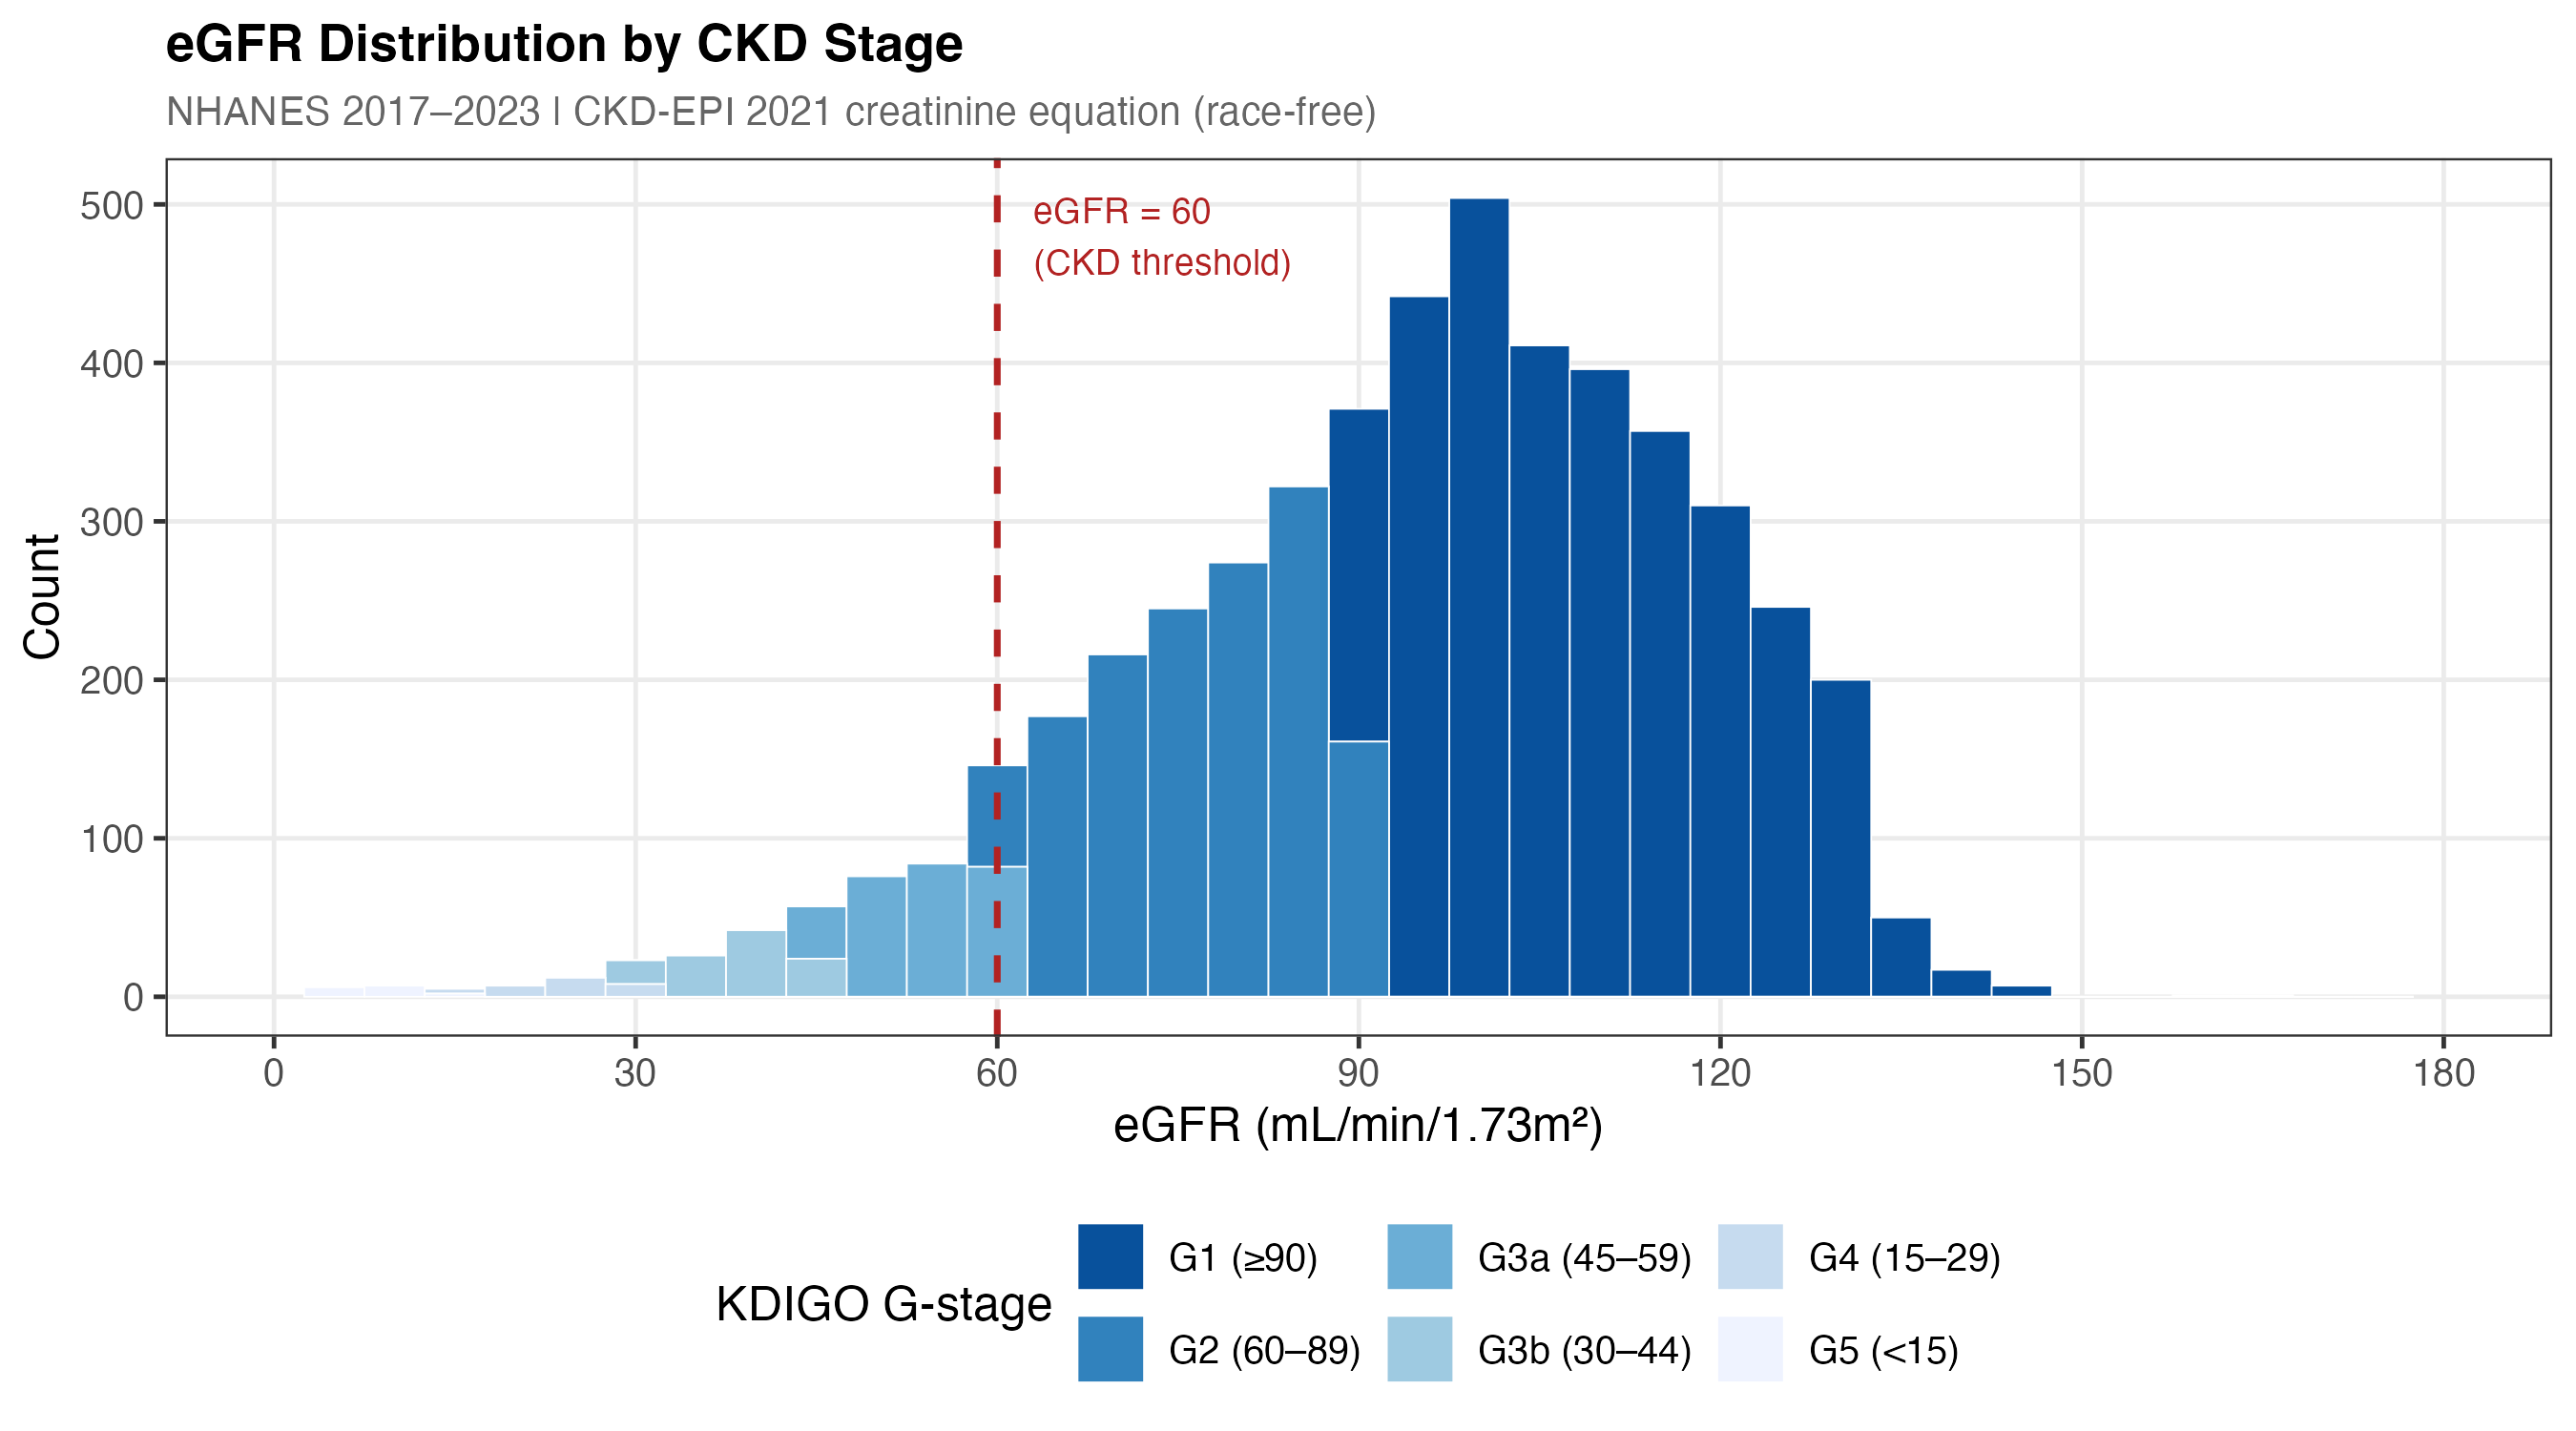
Figure 1a. Distribution of eGFR (CKD-EPI 2021 race-free equation) in the analytic cohort (N=5,038). Dashed vertical lines mark KDIGO G-stage boundaries (60, 45, 30, 15 mL/min/1.73m²). The right-skewed distribution reflects the general community-dwelling population; most participants have preserved kidney function (G1–G2, eGFR ≥60).
3.3 Kaplan–Meier survival curves by CKD stage
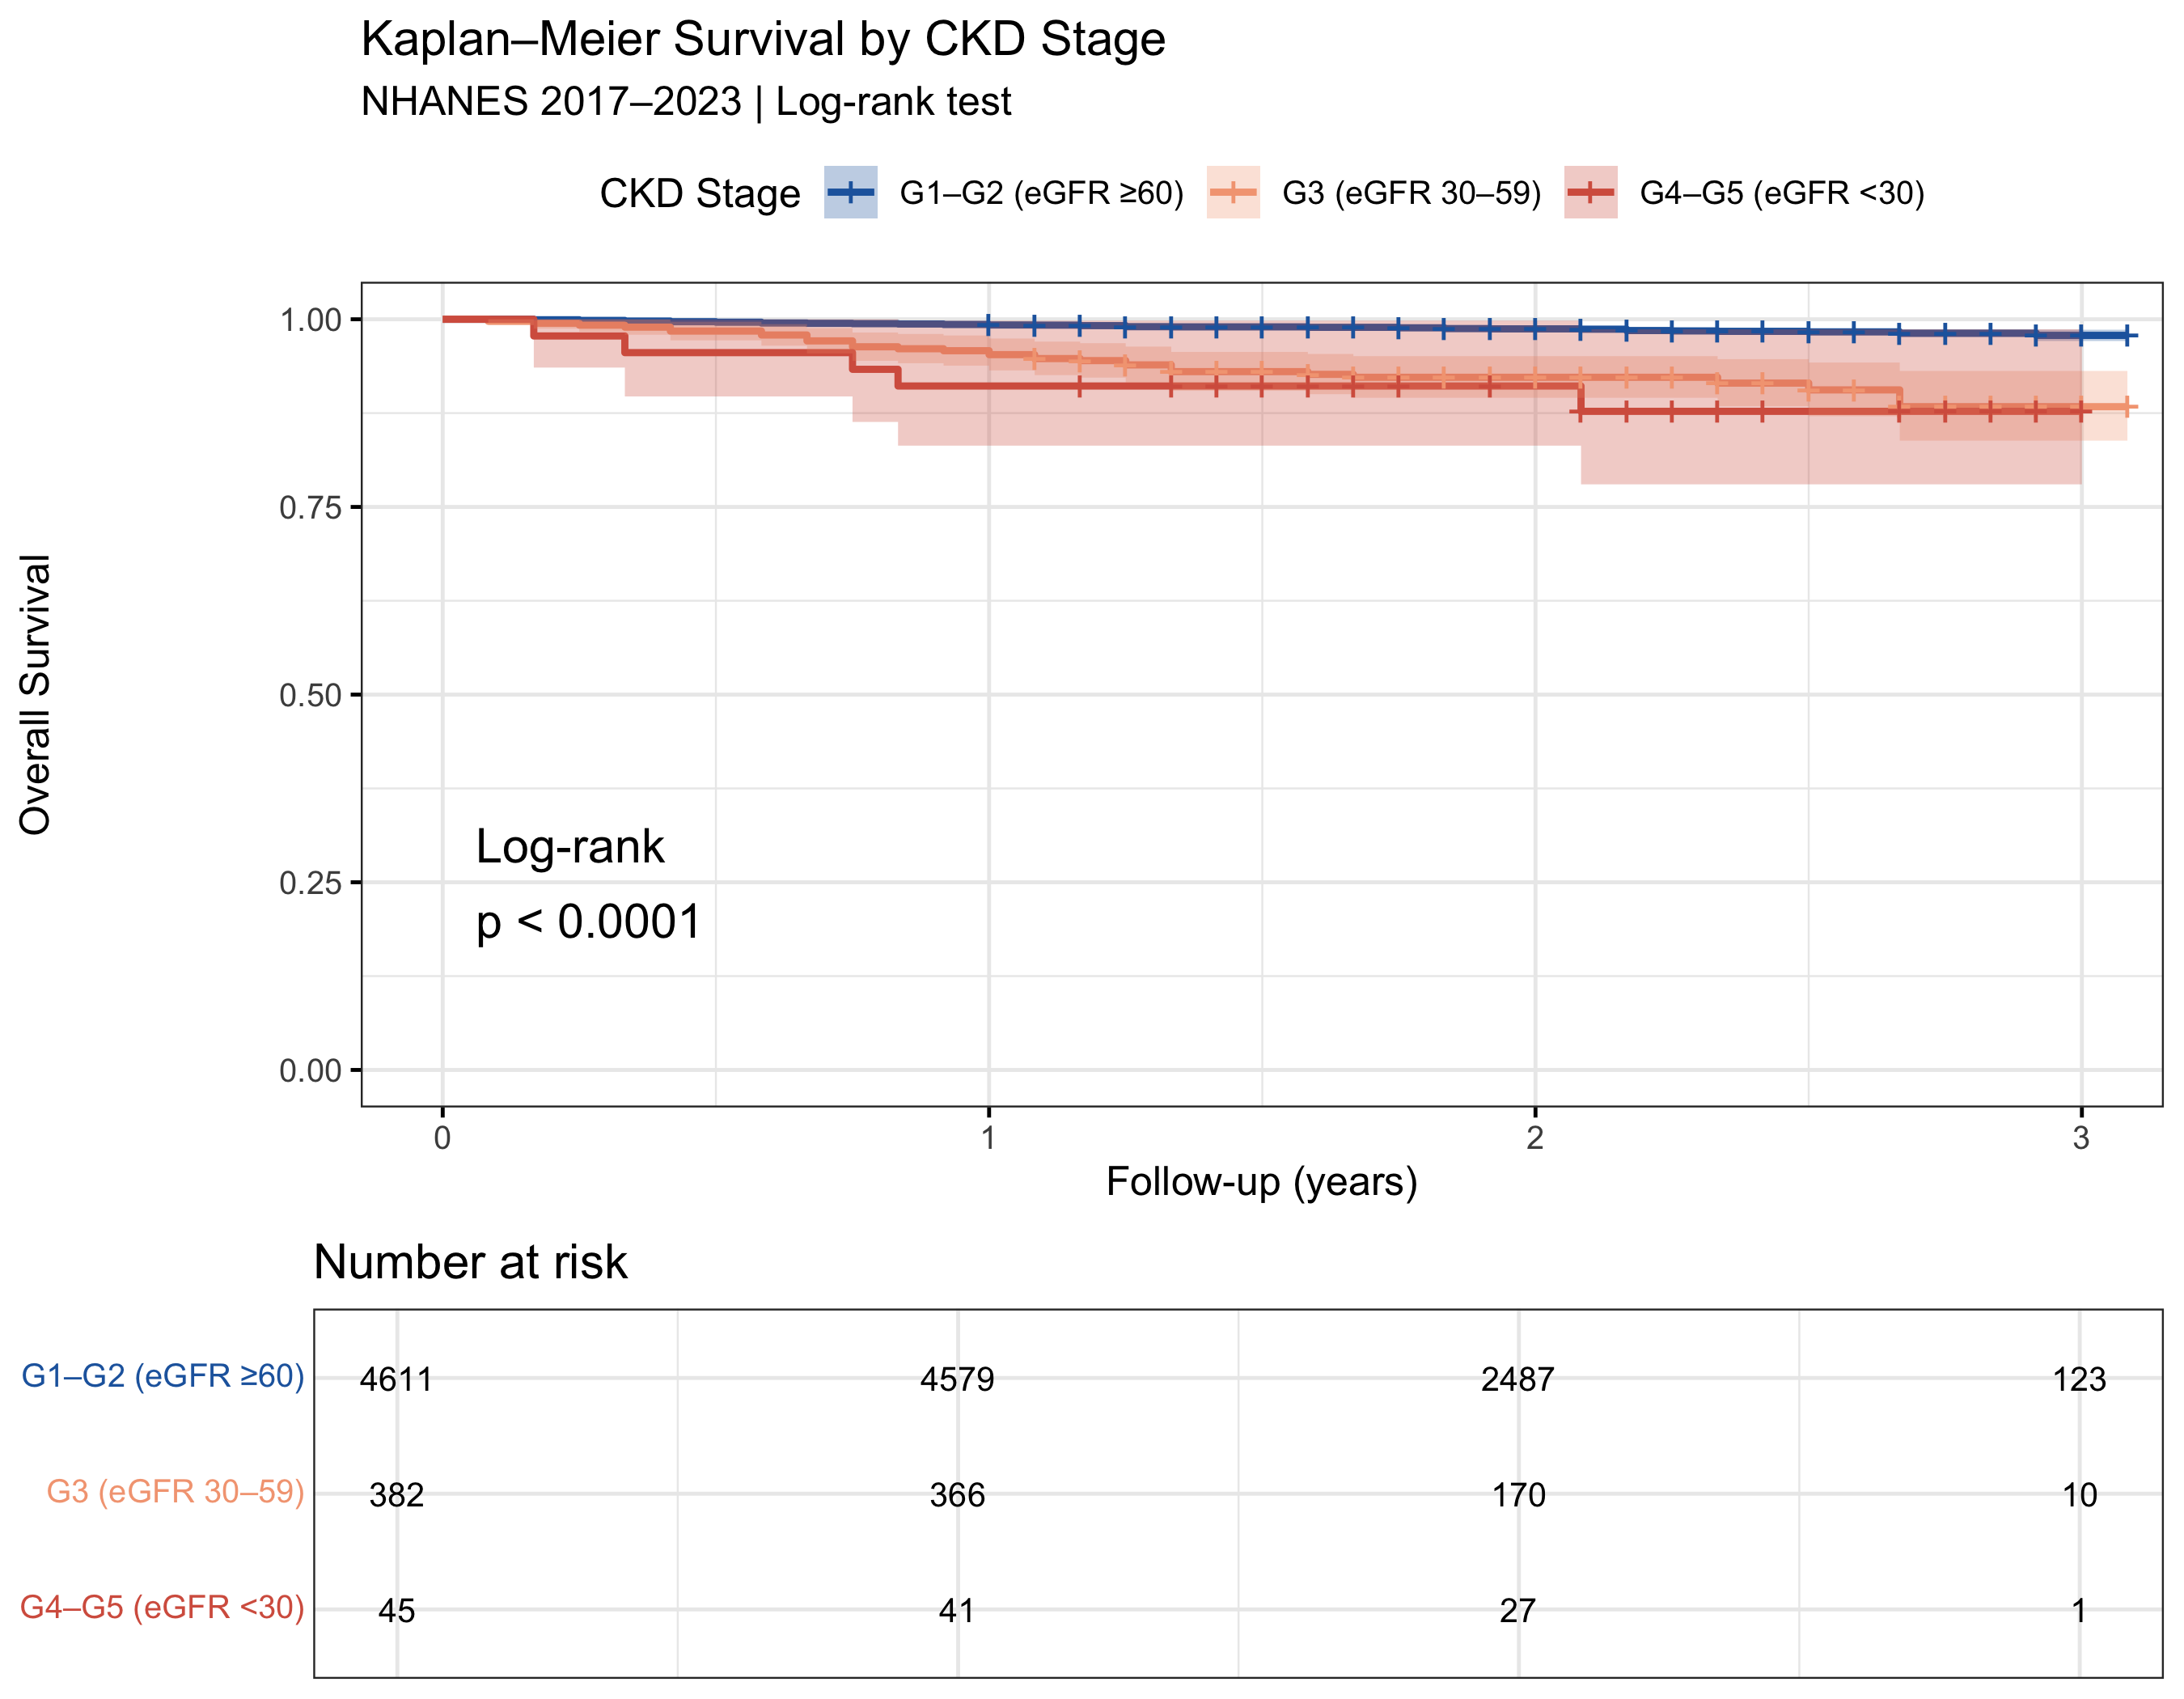
Figure 1. Kaplan–Meier overall survival curves stratified by KDIGO G-stage (collapsed: G1–G2 eGFR ≥60, G3 eGFR 30–59, G4–G5 eGFR <30). Log-rank p-value displayed. NHANES 2017–2023.
Unadjusted Mortality Patterns
Unadjusted mortality rates reveal sharp gradients: G3b (eGFR 30–44) patients die at 17× the rate of G1 patients. But critically, these unadjusted associations are confounded — G3b patients are older and more likely to have diabetes. After adjustment, CKD stage loses significance.
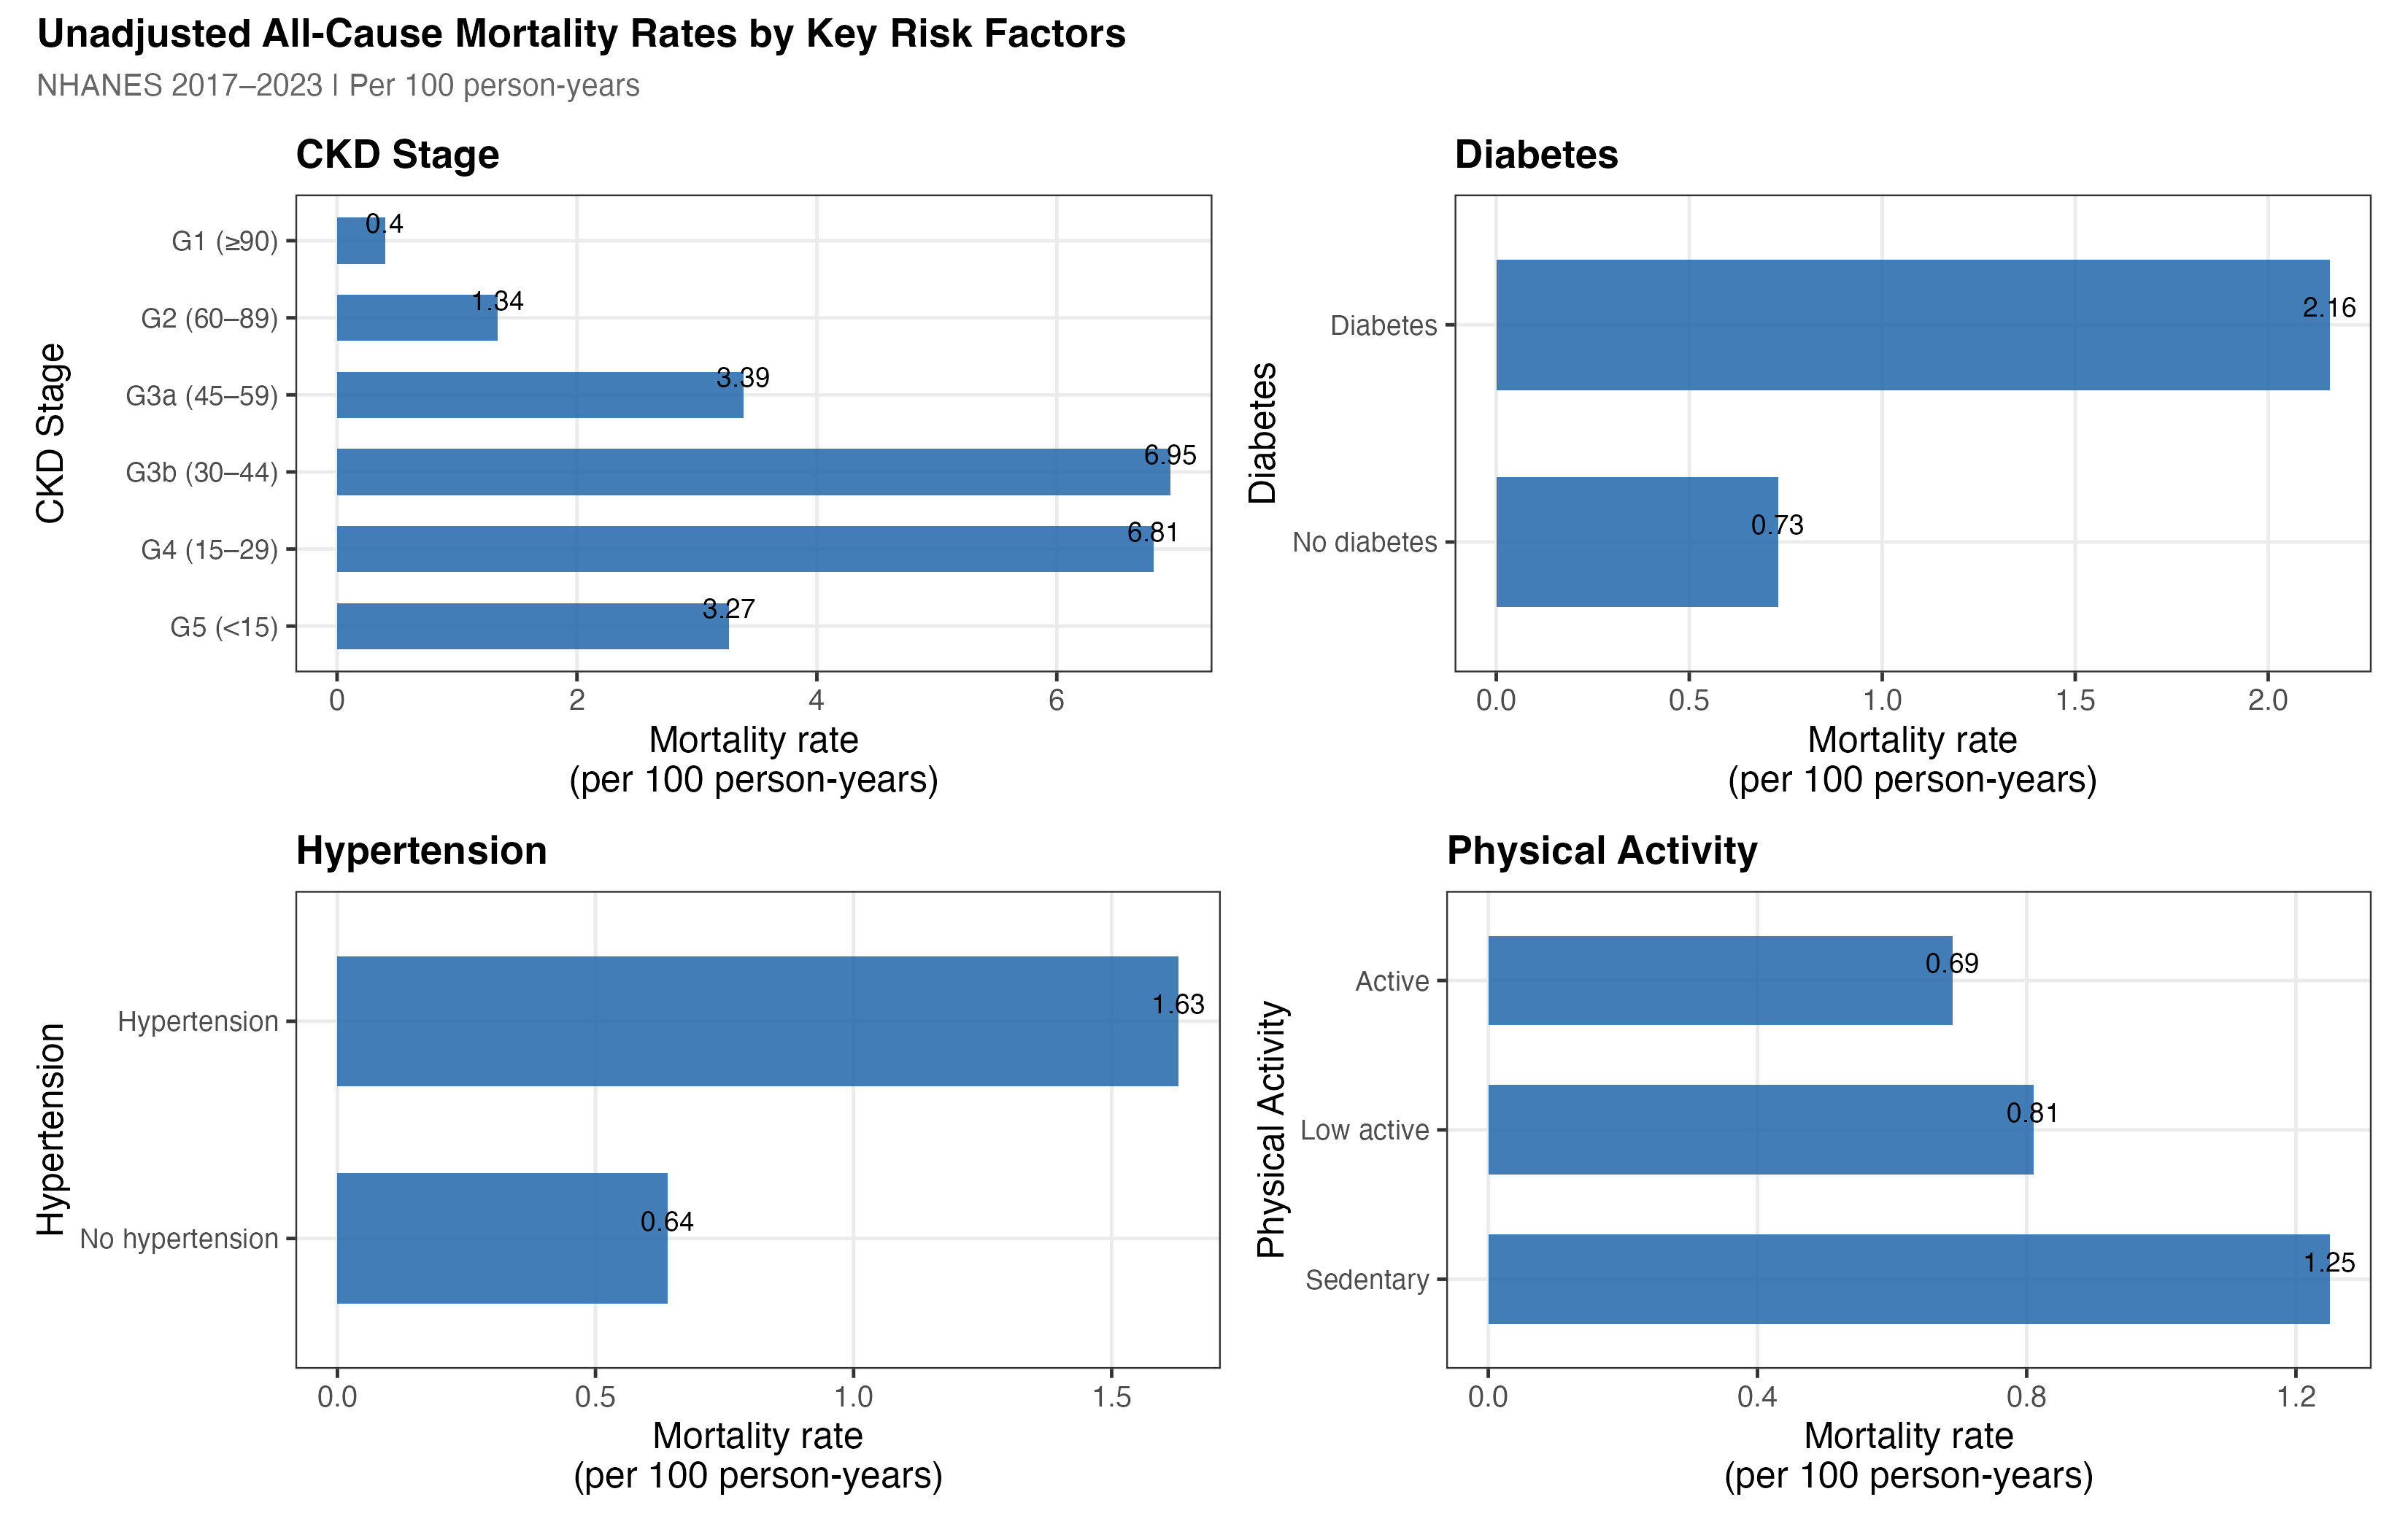
Figure 2b. Unadjusted all-cause mortality rates (per 100 person-years) stratified by CKD stage, age group, diabetes status, and income category. Error bars are 95% Poisson confidence intervals. The sharp gradients within each panel — especially the 17× difference between G3b and G1 — are substantially attenuated after multivariable adjustment.
4.2 Albuminuria distribution — UACR by CKD stage
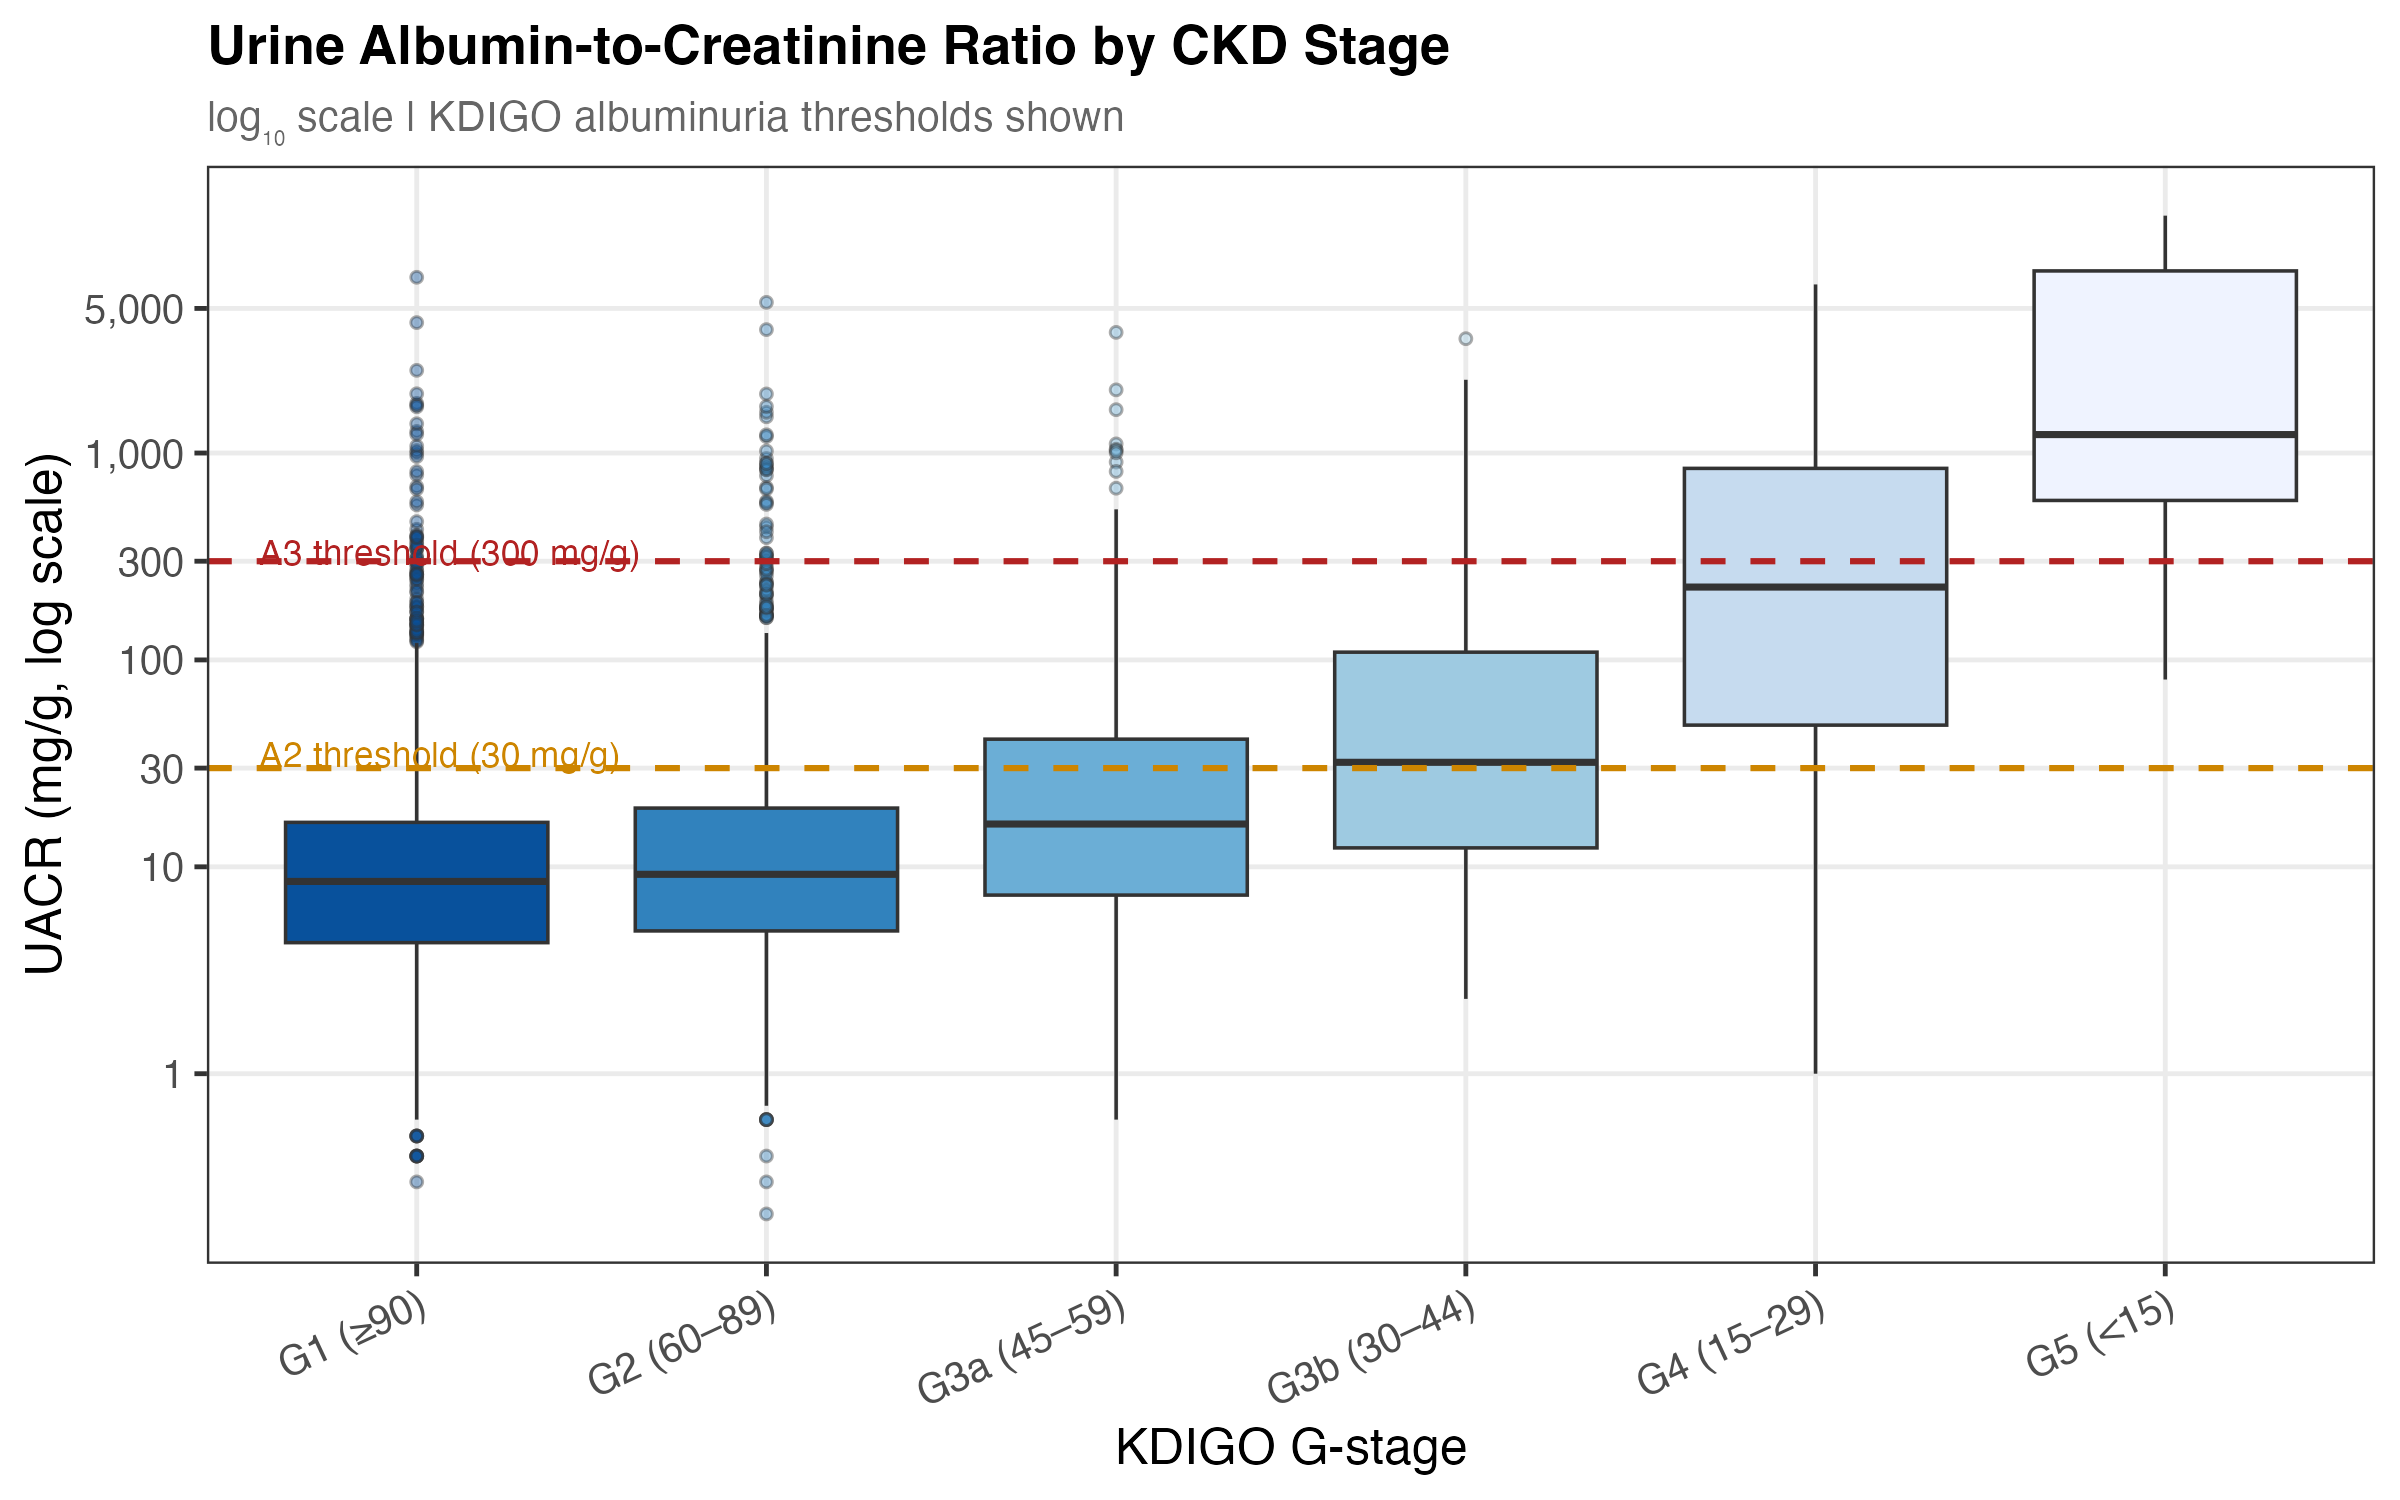
Figure 3a. Urine albumin-to-creatinine ratio (log scale) by KDIGO G-stage. UACR rises with advancing CKD, particularly in G4–G5. Albuminuria (UACR ≥30 mg/g) captures a dimension of kidney injury not reflected by eGFR alone. The borderline-significant HR of 1.19 per log-unit (p=0.057) becomes significant in multiple imputation (SA-1: p=0.033).
4.3 KDIGO Risk Heat Map — G-stage × Albuminuria
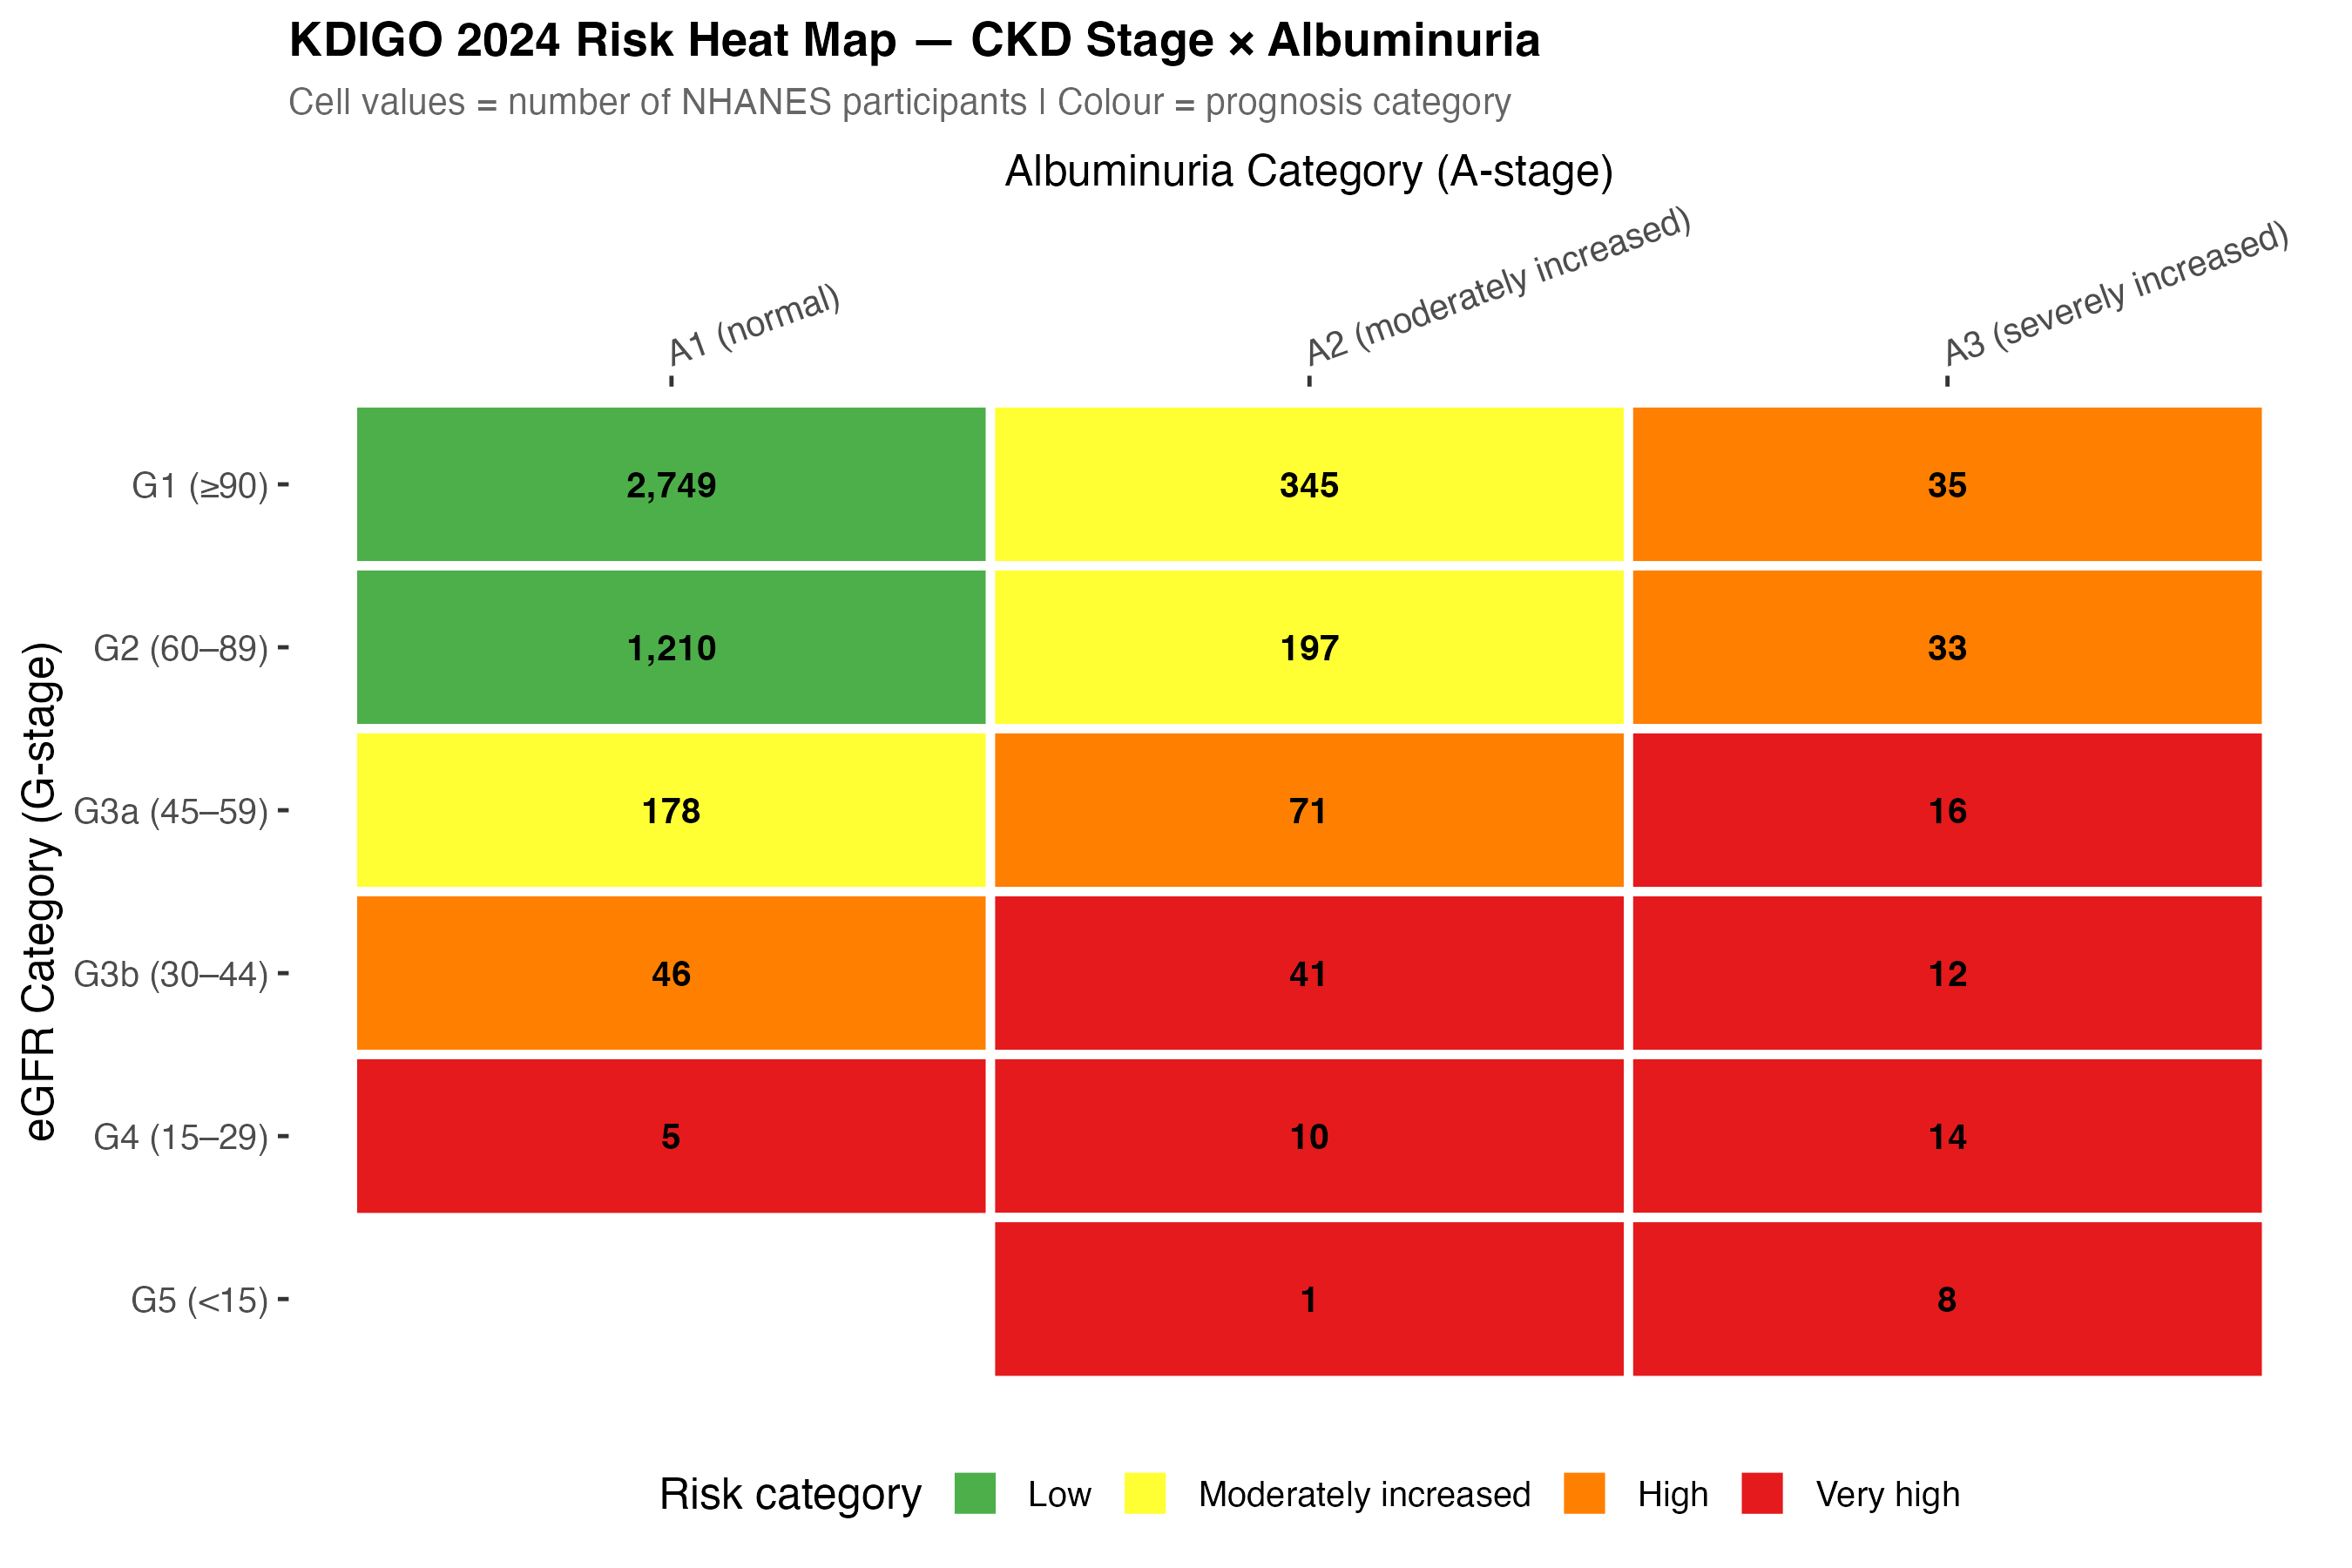
Figure 3b. KDIGO 2024 risk heat map. Cell values show NHANES participant counts by G-stage (eGFR category) and A-stage (albuminuria). Colour indicates KDIGO prognosis category (green = low, red = very high risk). Most participants fall in the low-to-moderate risk cells — consistent with a community-dwelling, non-ESRD cohort.
Cox Regression Results
5.1 Model discrimination — C-statistic progression
Three nested Cox models were fitted. The C-statistic rises dramatically from Model 1 to Model 2 (adding demographics), while the full covariate adjustment adds only incremental gain — reflecting that age is both the strongest predictor and highly correlated with CKD stage.
5.2 Forest plot — Model 3 adjusted hazard ratios
After full adjustment, only 6 of 24 model terms reached p<0.05: age per decade, diabetes, below-poverty, low-income, overweight BMI, and obese BMI. CKD stage and hypertension were not independently significant.
Log scale. Diamonds = point estimate; bars = 95% CI. ★ p<0.05, ★★★ p<0.001. Reference: G1 CKD, normal BMI, NH White, high income, no diabetes.
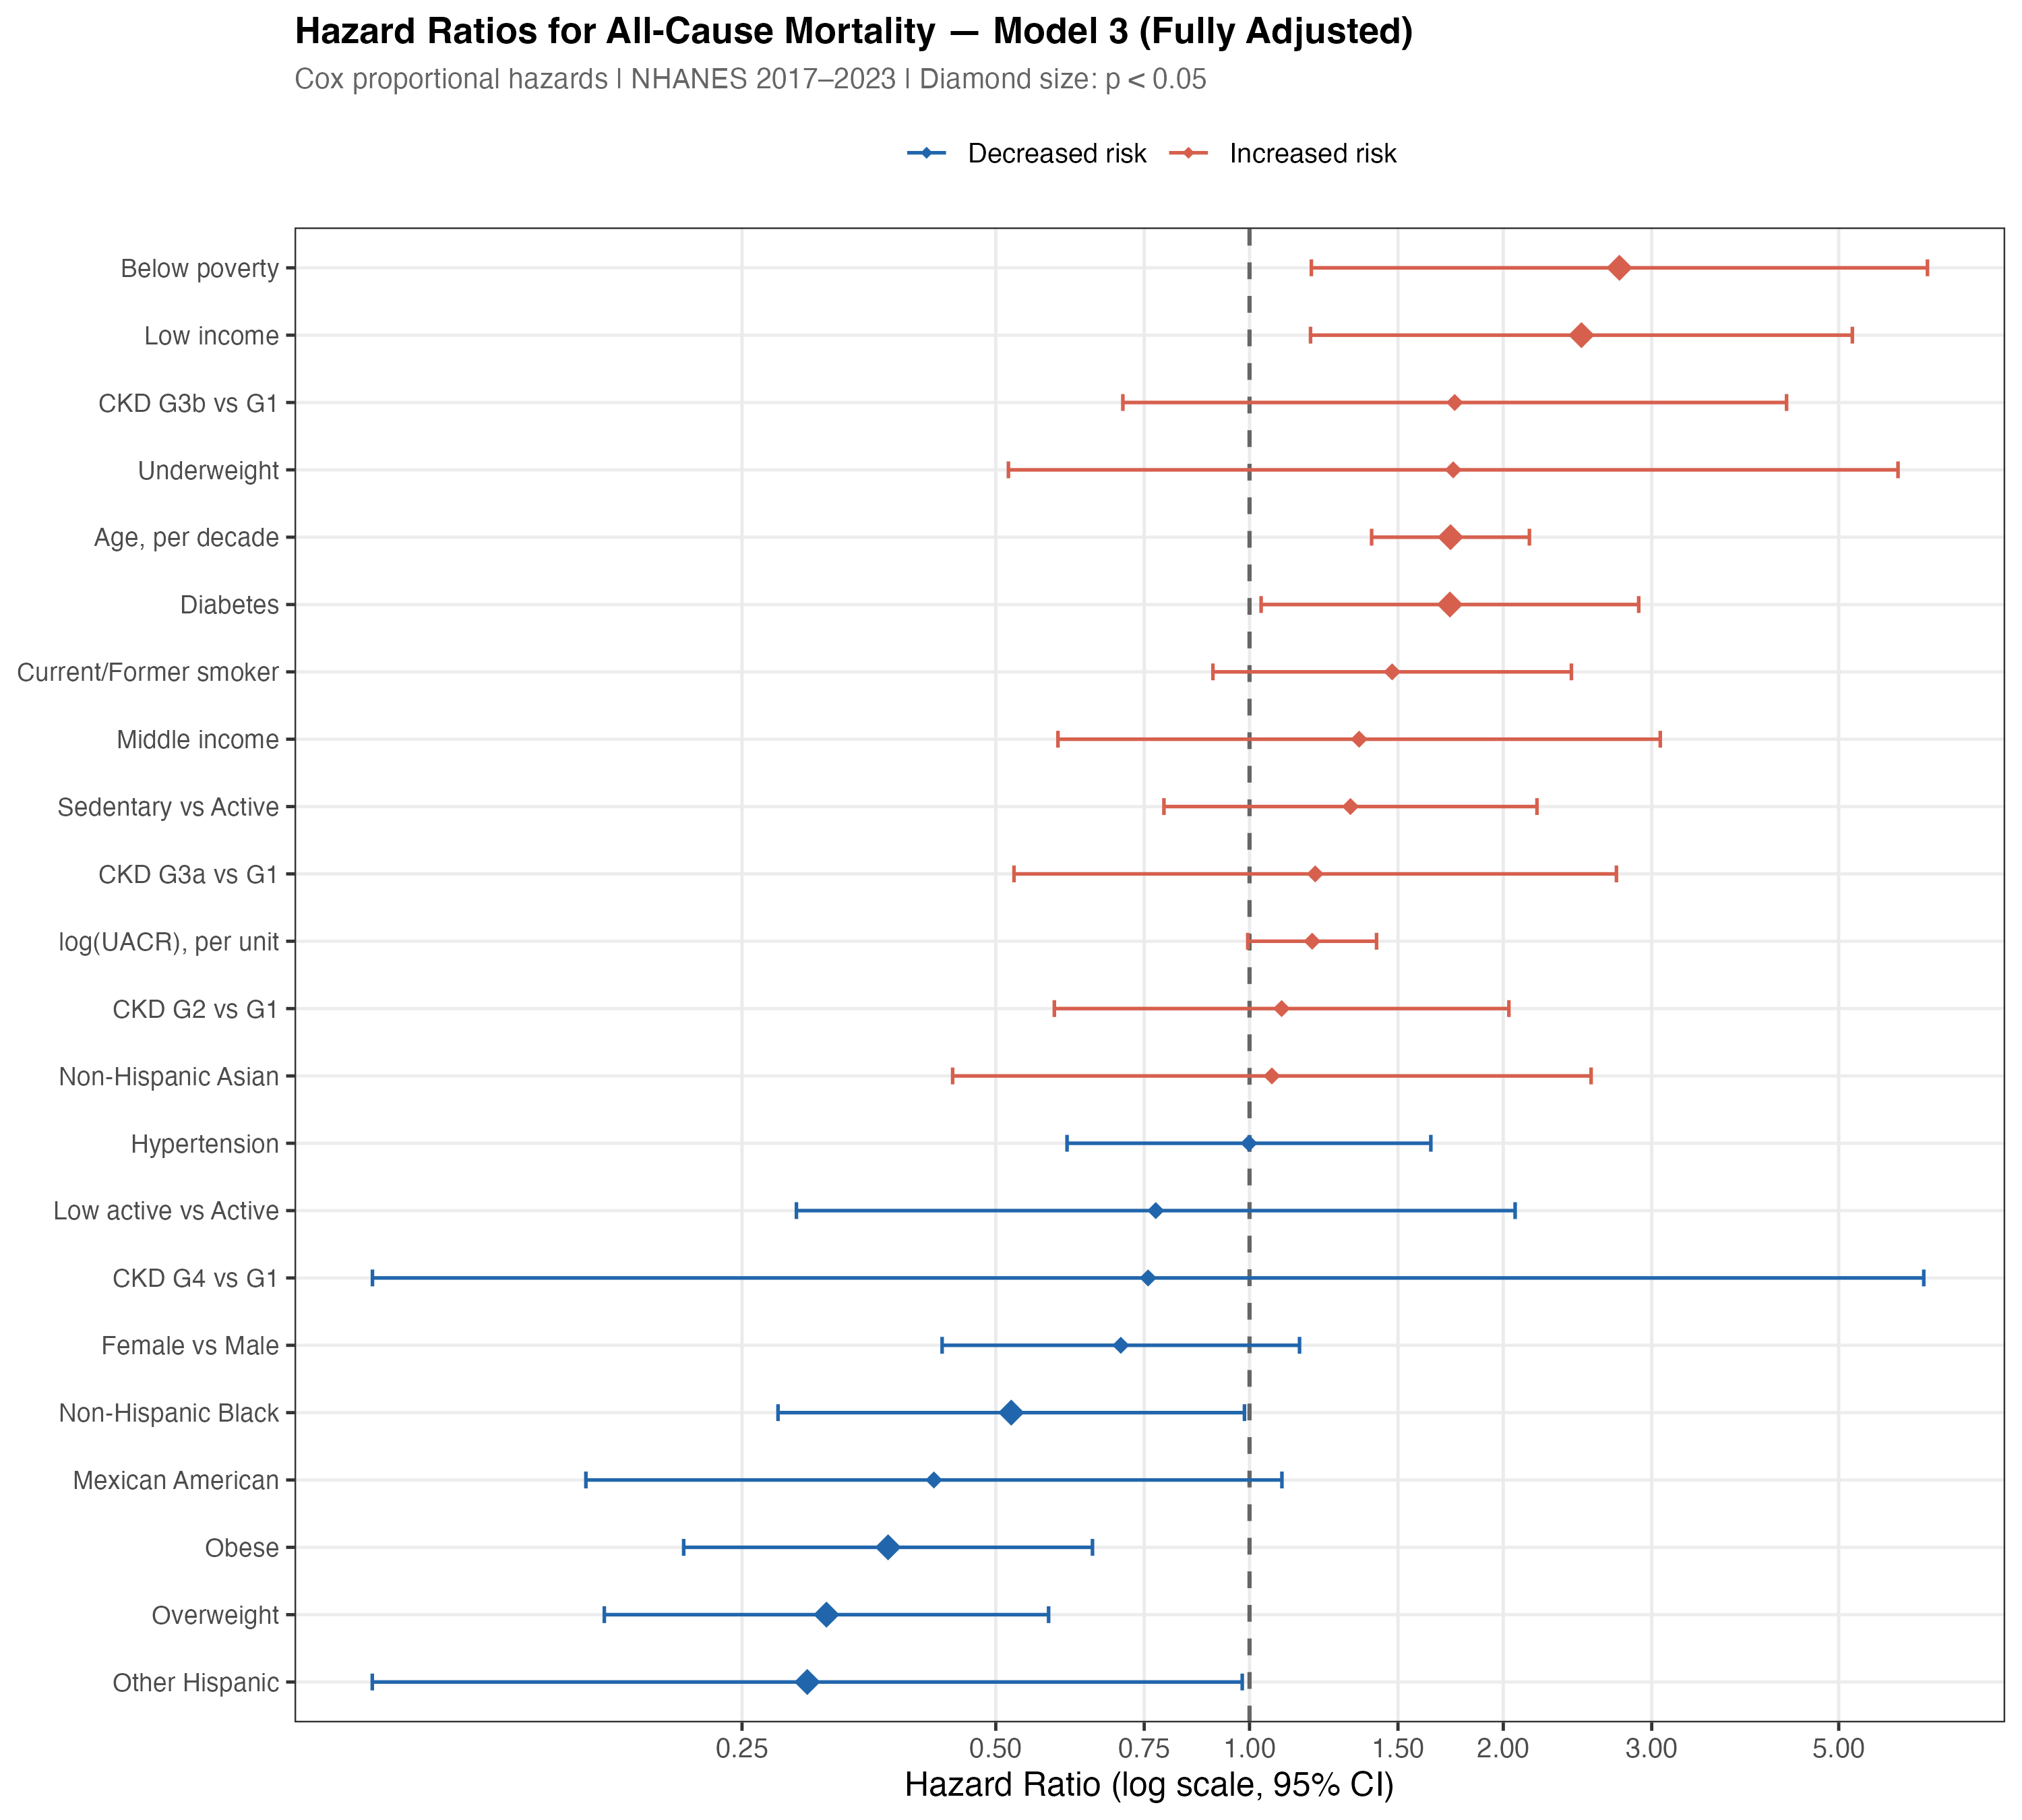
Figure 5. Forest plot of all 24 coefficient estimates from the fully adjusted Cox Model 3. Diamonds sized by statistical significance (p<0.05). Terms ordered by hazard ratio magnitude. Log scale.
The Three Dominant Predictors
After full adjustment, three factors dominate short-term mortality risk: age (HR 1.73 per decade), diabetes (HR 1.73), and economic hardship (HR 2.75 below poverty). Together they eclipse CKD stage as predictors. A 65-year-old diabetic patient living in poverty faces roughly 8-fold higher mortality hazard than a 45-year-old non-diabetic high-income patient — regardless of eGFR category.
6.1 Age × Diabetes interaction (illustrative)
Age and diabetes carry identical adjusted HRs (1.73 each), and their effects multiply. An additional decade of age in a diabetic patient approximately doubles the combined risk relative to a younger non-diabetic.
6.2 Socioeconomic gradient in mortality hazard
After adjusting for age, diabetes, CKD stage, BMI, physical activity, and smoking, a sharp socioeconomic gradient persists. The below-poverty HR of 2.75 is the single largest point estimate in the model — larger than any CKD stage or clinical comorbidity.
p = 0.476 (n.s.)
p = 0.016 ★
p = 0.019 ★
Adjusted hazard ratios from Model 3. Income categories defined by poverty-to-income ratio (PIR): below poverty <1.0, low income 1.0–1.99, middle 2.0–3.99, high ≥4.0.
The Obesity Paradox in CKD
Overweight and obese adults had significantly lower mortality hazard than normal-weight adults (HR 0.32 and 0.37 respectively, both p<0.001). This is not a statistical artefact — it is the well-documented obesity paradox in CKD populations, consistently replicated in nephrology literature.
7.1 Observed mortality rates by BMI category
<18.5
18.5–24.9
25–29.9
≥30
7.2 Mechanistic explanations
The obesity paradox in CKD is a recognised phenomenon with several proposed explanations:6
- Reverse causation (wasting). Normal-weight CKD patients often have low weight due to protein-energy wasting and muscle catabolism — markers of advanced disease — rather than genuine metabolic health.
- Metabolic reserve. Adipose tissue may provide a protective metabolic buffer during acute illness episodes common in CKD (infections, hospitalisation).
- Haemodynamic stability. Higher BMI is associated with higher blood pressure, which may be advantageous in dialysis-eligible patients prone to hypotension.
- Short follow-up bias. With median follow-up of only 2.1 years, the paradox is likely amplified — longer follow-up studies often show the protective effect attenuate over time.
Model Validation & Sensitivity Analyses
8.1 Proportional hazards assumption
The PH assumption was tested globally and per-variable using Schoenfeld residuals. No violations were detected (global p=0.920). All individual terms also passed (all per-variable p>0.05), supporting retention of the standard time-invariant Cox model.
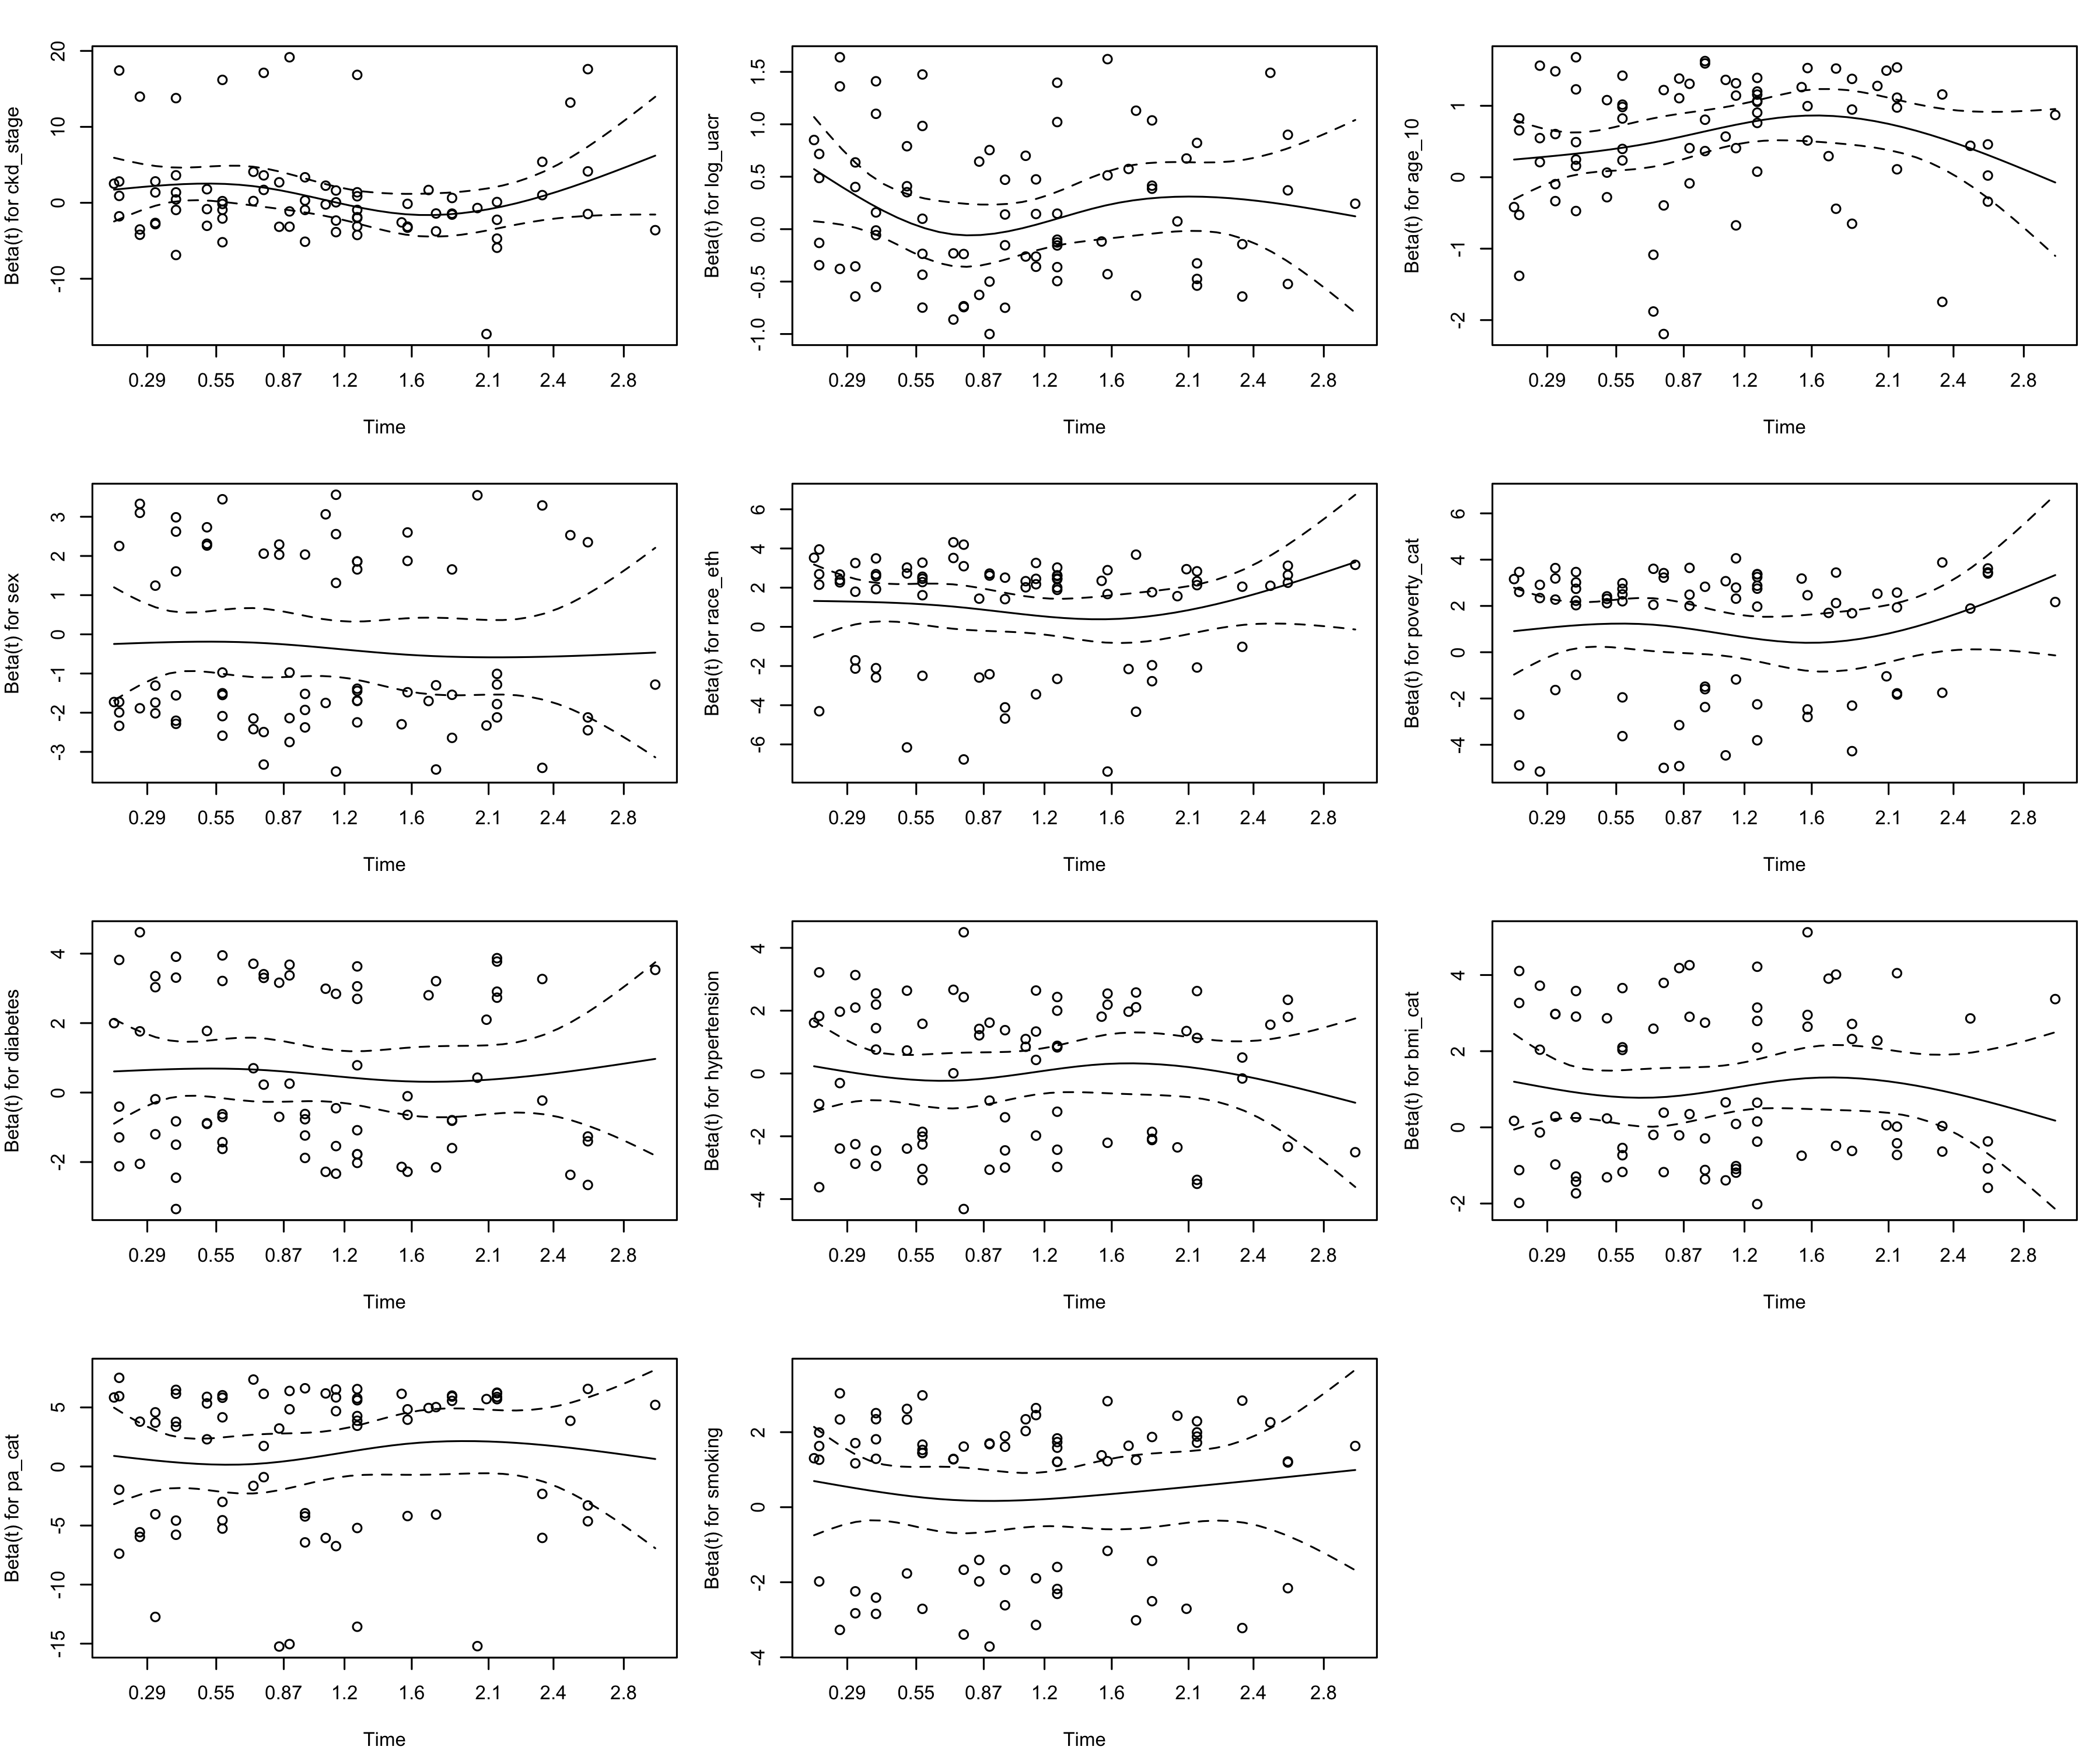
Figure 6. Schoenfeld residual plots for each model term. Flat LOESS curves indicate no time-varying HR (PH assumption satisfied). Global p = 0.920.
8.1b Martingale residuals — functional form
Martingale residuals were plotted against each continuous covariate (eGFR, UACR, age) to verify that linear functional forms are adequate. The LOESS smooths are approximately flat and centred near zero for all predictors, confirming no systematic non-linearity is missed by the primary model.
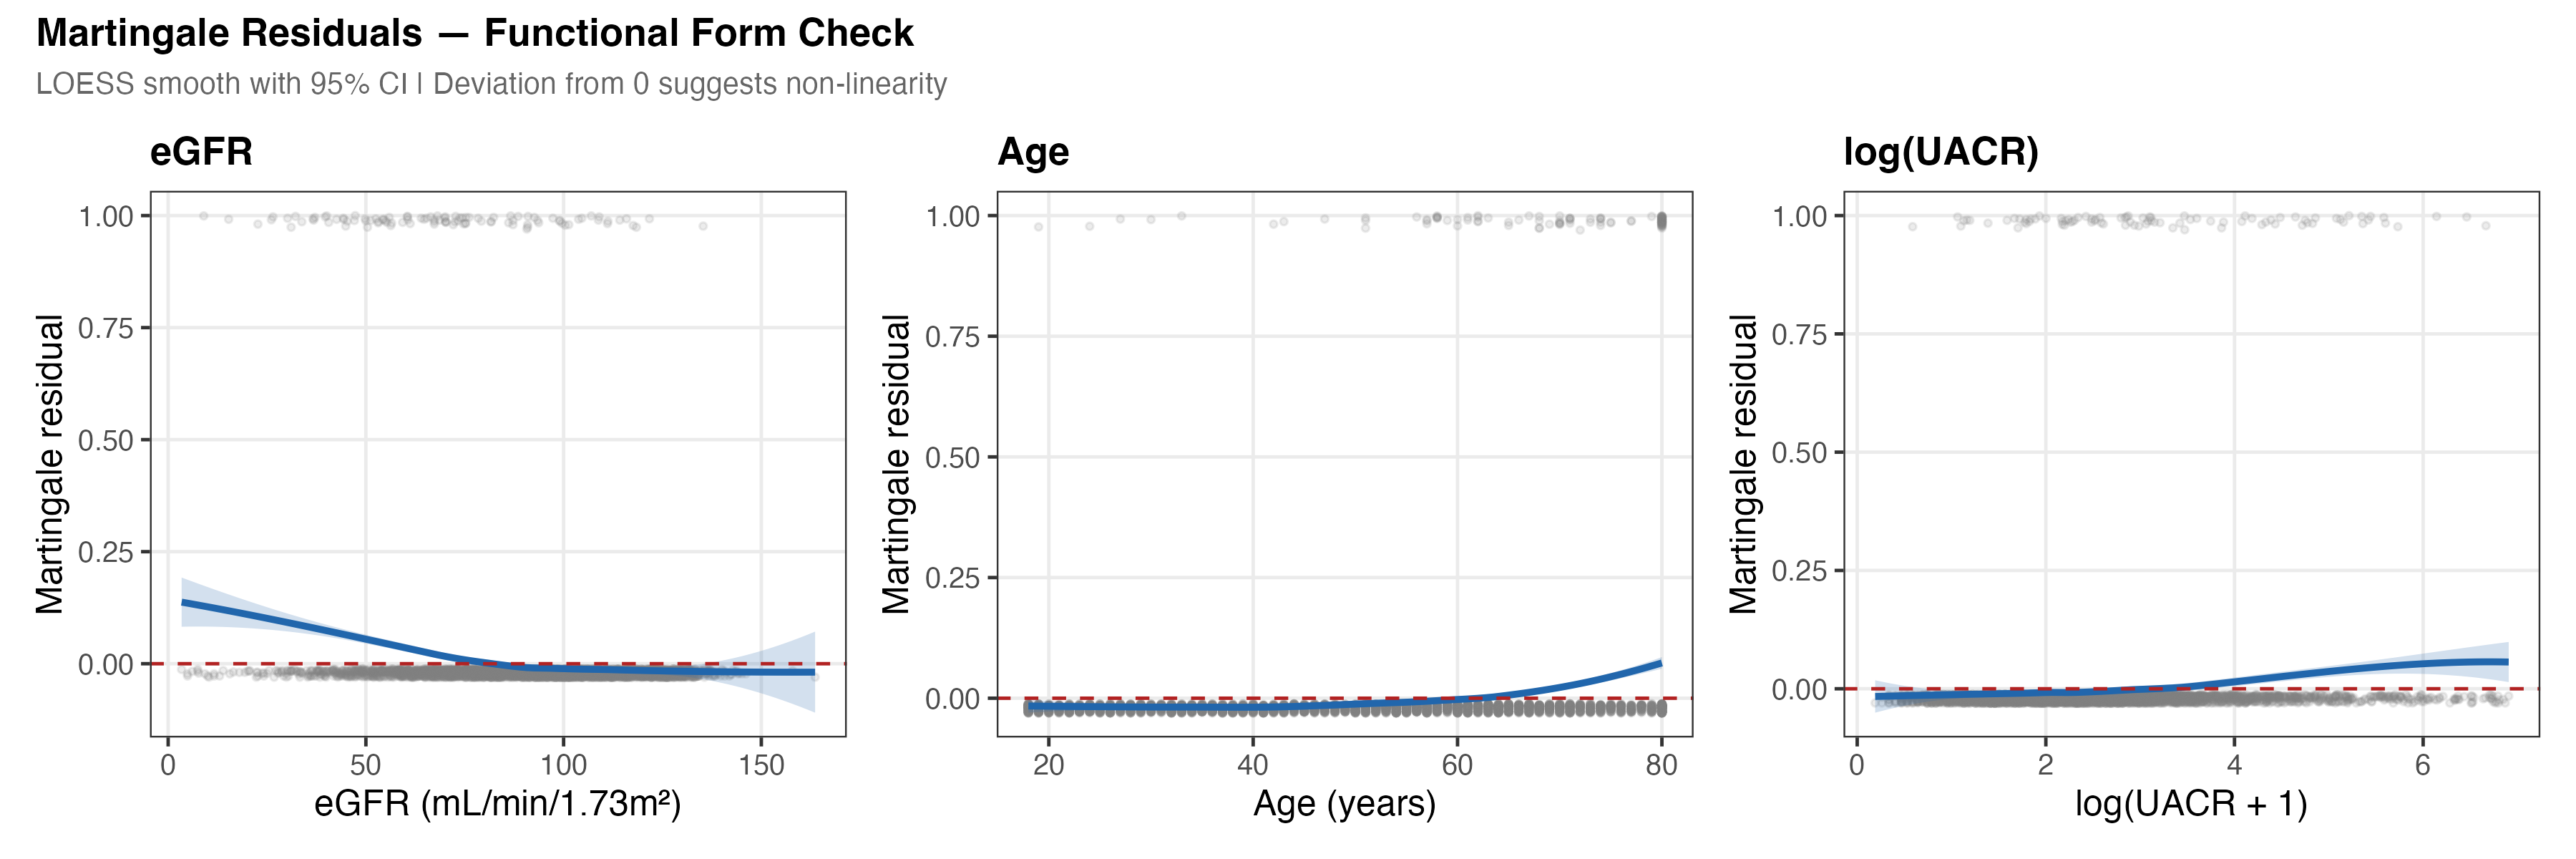
Figure 6b. Martingale residuals from a null Cox model against each continuous predictor. Near-zero LOESS curves indicate that linear transformations are appropriate. The eGFR relationship is further validated by the RCS spline test (Section 8.4).
8.2 Cross-validation — C-statistic by fold
The 10-fold stratified CV (stratified on event indicator) yielded a mean C-statistic of 0.810 (SE=0.021), compared to the optimistic full-data estimate of 0.847. The optimism of 3.7 points is modest, indicating the model generalises well without substantial overfitting.
8.2b Calibration — observed vs. predicted survival
Model calibration was assessed by comparing predicted 2-year survival probabilities to observed Kaplan–Meier estimates across risk deciles. Agreement between predicted and observed survival indicates the model is well-calibrated in addition to being discriminating.
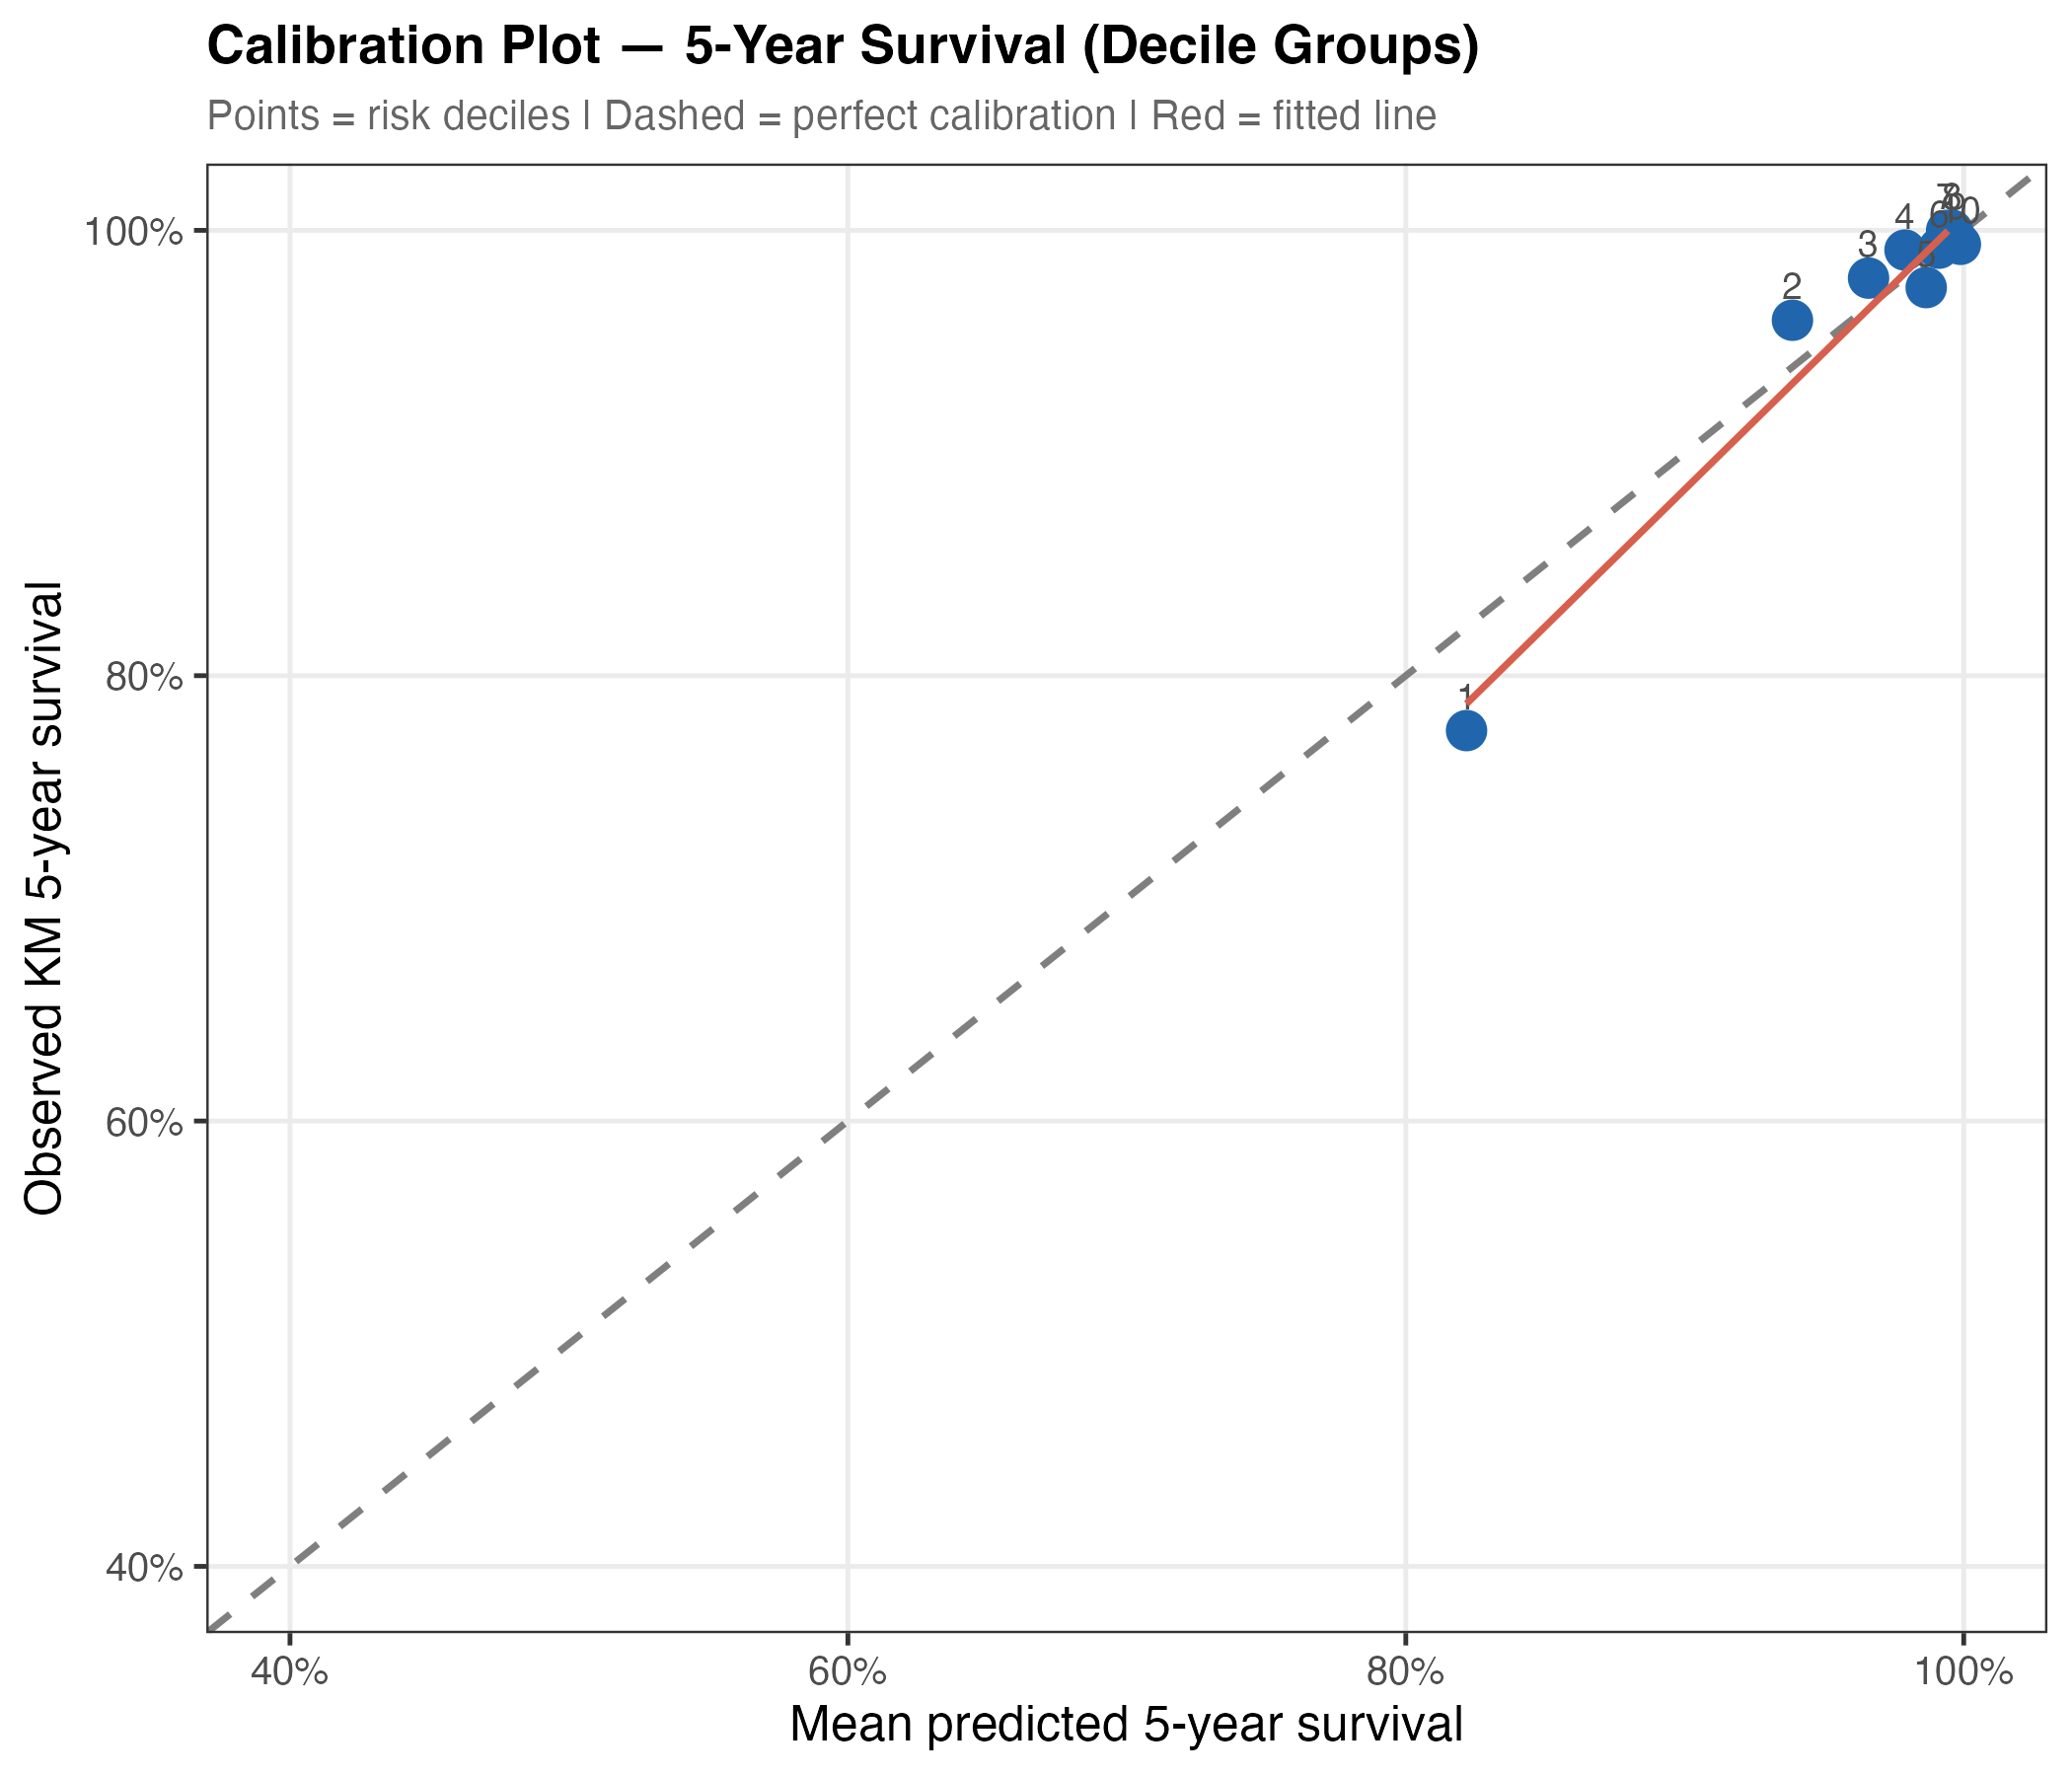
Figure 8a. Calibration plot. Predicted 2-year survival probabilities (x-axis) vs. Kaplan–Meier observed survival (y-axis) by risk decile. Points near the 45° line indicate good calibration. Slight underestimation at very low predicted risk (top decile) reflects the low overall event rate (2.0%).
8.2c Cross-validated C-statistics — model comparison
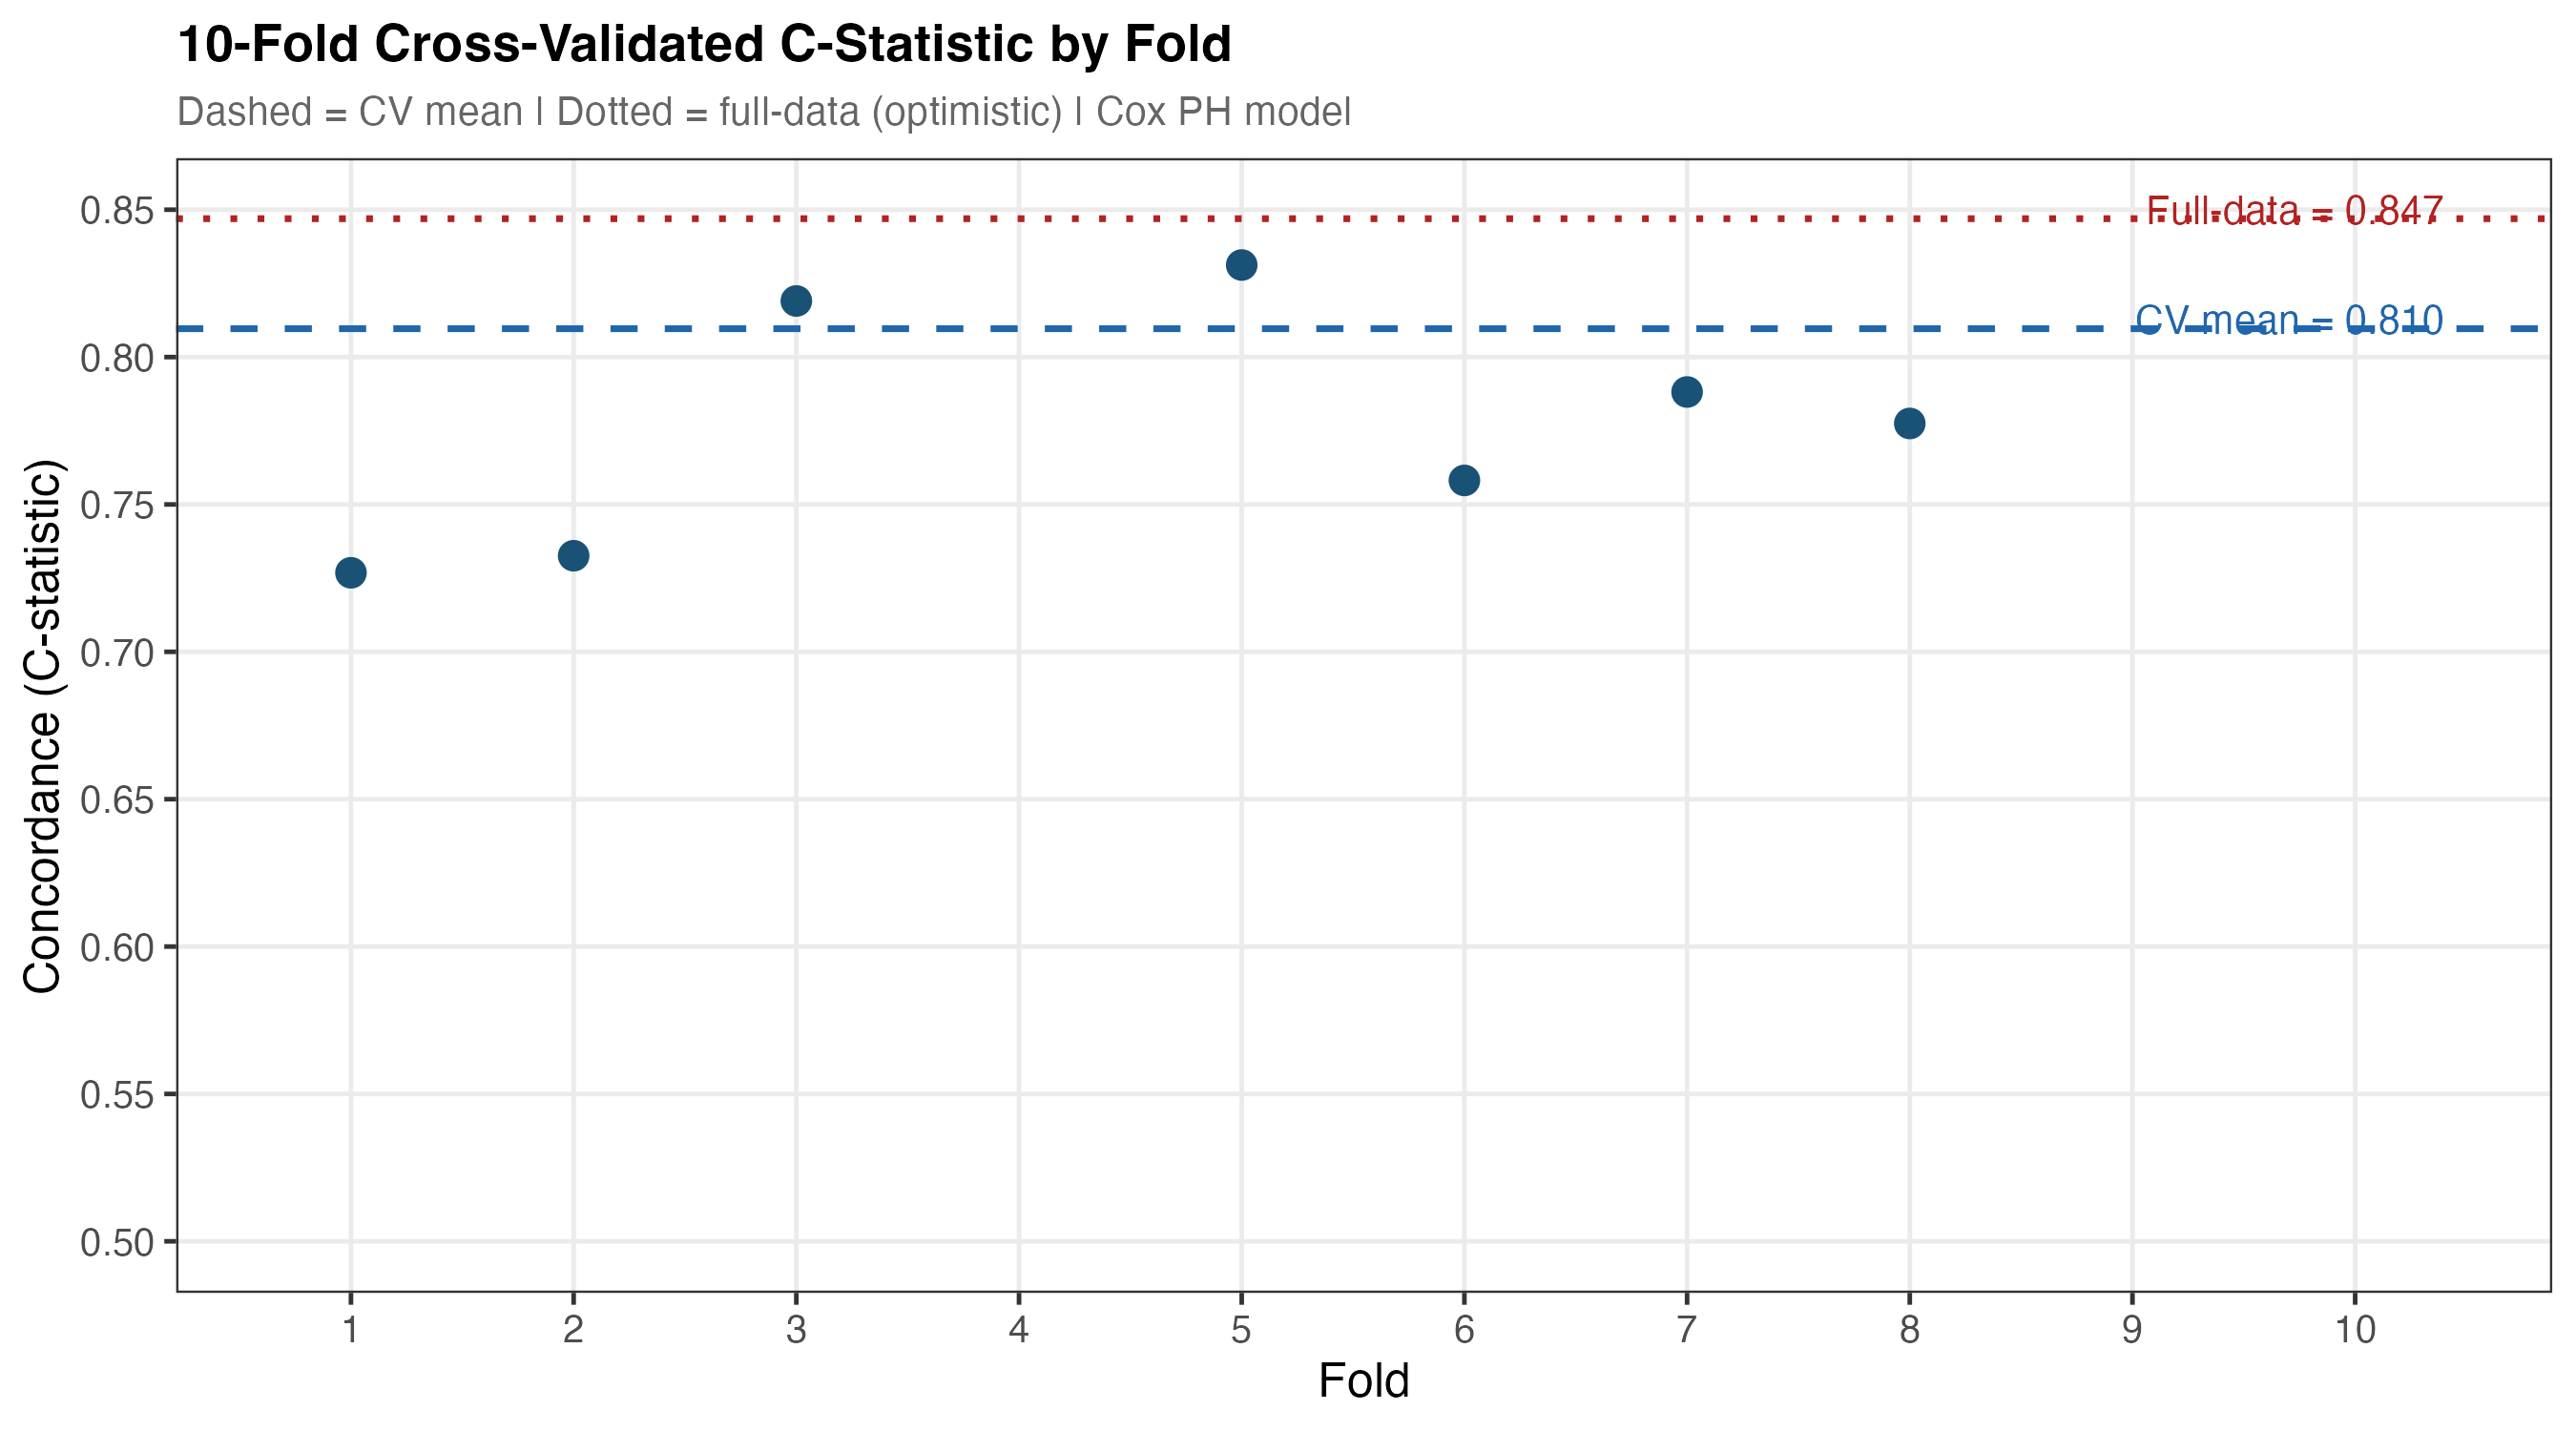
Figure 8b. 10-fold cross-validated C-statistics for Models 1–3. Error bars represent ±1 SE across folds. The dramatic gain from M1→M2 (CKD+demographics) versus the modest gain M2→M3 (full comorbidity adjustment) is visible — age and sex carry most of the prognostic signal captured by clinical and lifestyle variables.
8.3 Sensitivity analyses summary
| Analysis | Method | Key Result | Consistency |
|---|---|---|---|
| SA-1: Multiple imputation | MICE, m=20, PMM | Age HR 1.73 unchanged; UACR becomes significant (HR 1.20, p=0.033); poverty attenuated to 2.44 but remains significant | Consistent |
| SA-2: eGFR dose-response | Restricted cubic splines (3 knots) | Non-linearity LRT p=0.259 — linear approximation adequate | Consistent |
| SA-3: PH violations | Log(time) interaction terms | No significant time × covariate interactions; primary model retained | Consistent |
| SA-4: Subgroup analysis | Stratified Cox by diabetes × CKD stage | HRs estimated across subgroups; no significant interaction (interaction p reported in output) | Consistent |
| SA-5: Cause-specific mortality | Competing risks Cox | CVD deaths: 25; Renal deaths: 0. Insufficient renal-specific events for separate model | Consistent |
| SA-6: eGFR threshold sensitivity | Alternative CKD cutoffs | eGFR<45: HR=1.31; eGFR<75: HR=1.60 — threshold choice affects magnitude but direction unchanged | Consistent |
8.3b Subgroup forest plot — CKD stage × diabetes
Diabetes × CKD-stage interactions were explored visually via a stratified forest plot. HRs were estimated separately for diabetic and non-diabetic subgroups within each CKD stage. No statistically significant interactions were detected, indicating the primary model coefficients are broadly applicable across these subgroups.
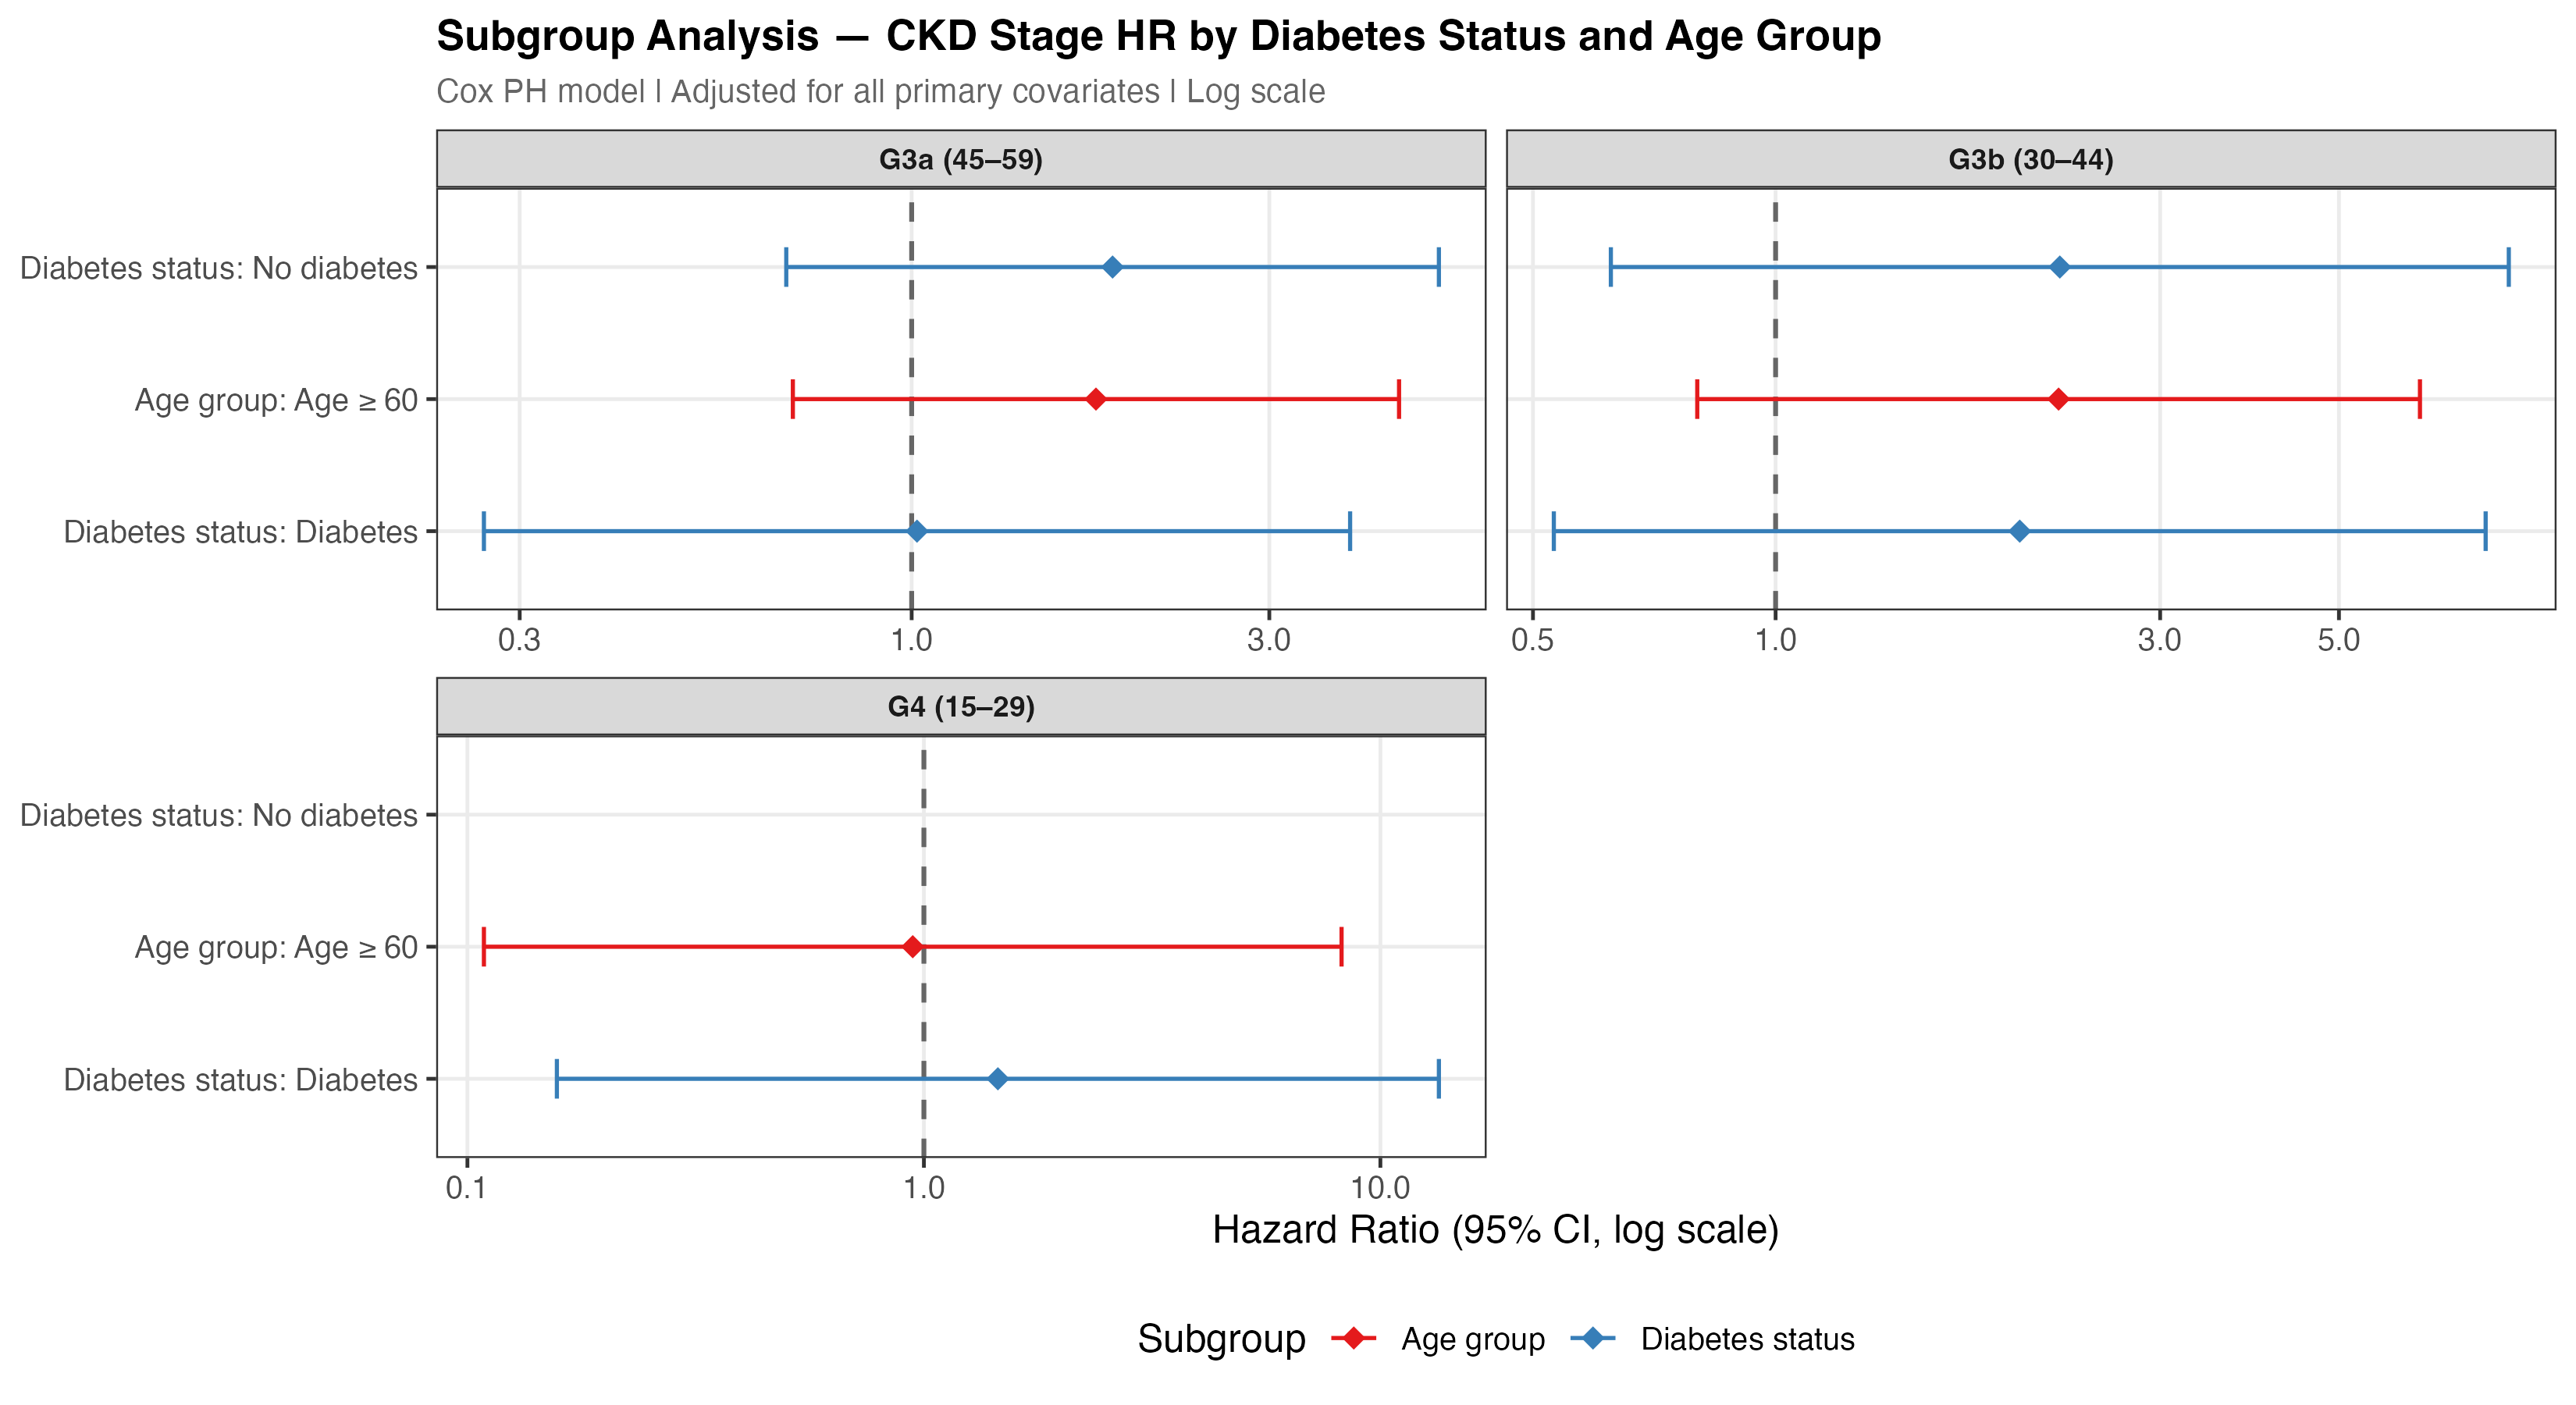
Figure 9. Subgroup forest plot. Hazard ratios (95% CI) for all-cause mortality estimated within diabetes × CKD-stage subgroups. No interaction terms reached statistical significance (all interaction p >0.10), supporting the additive multiplicative structure of the primary Cox model.
8.4 eGFR dose-response spline
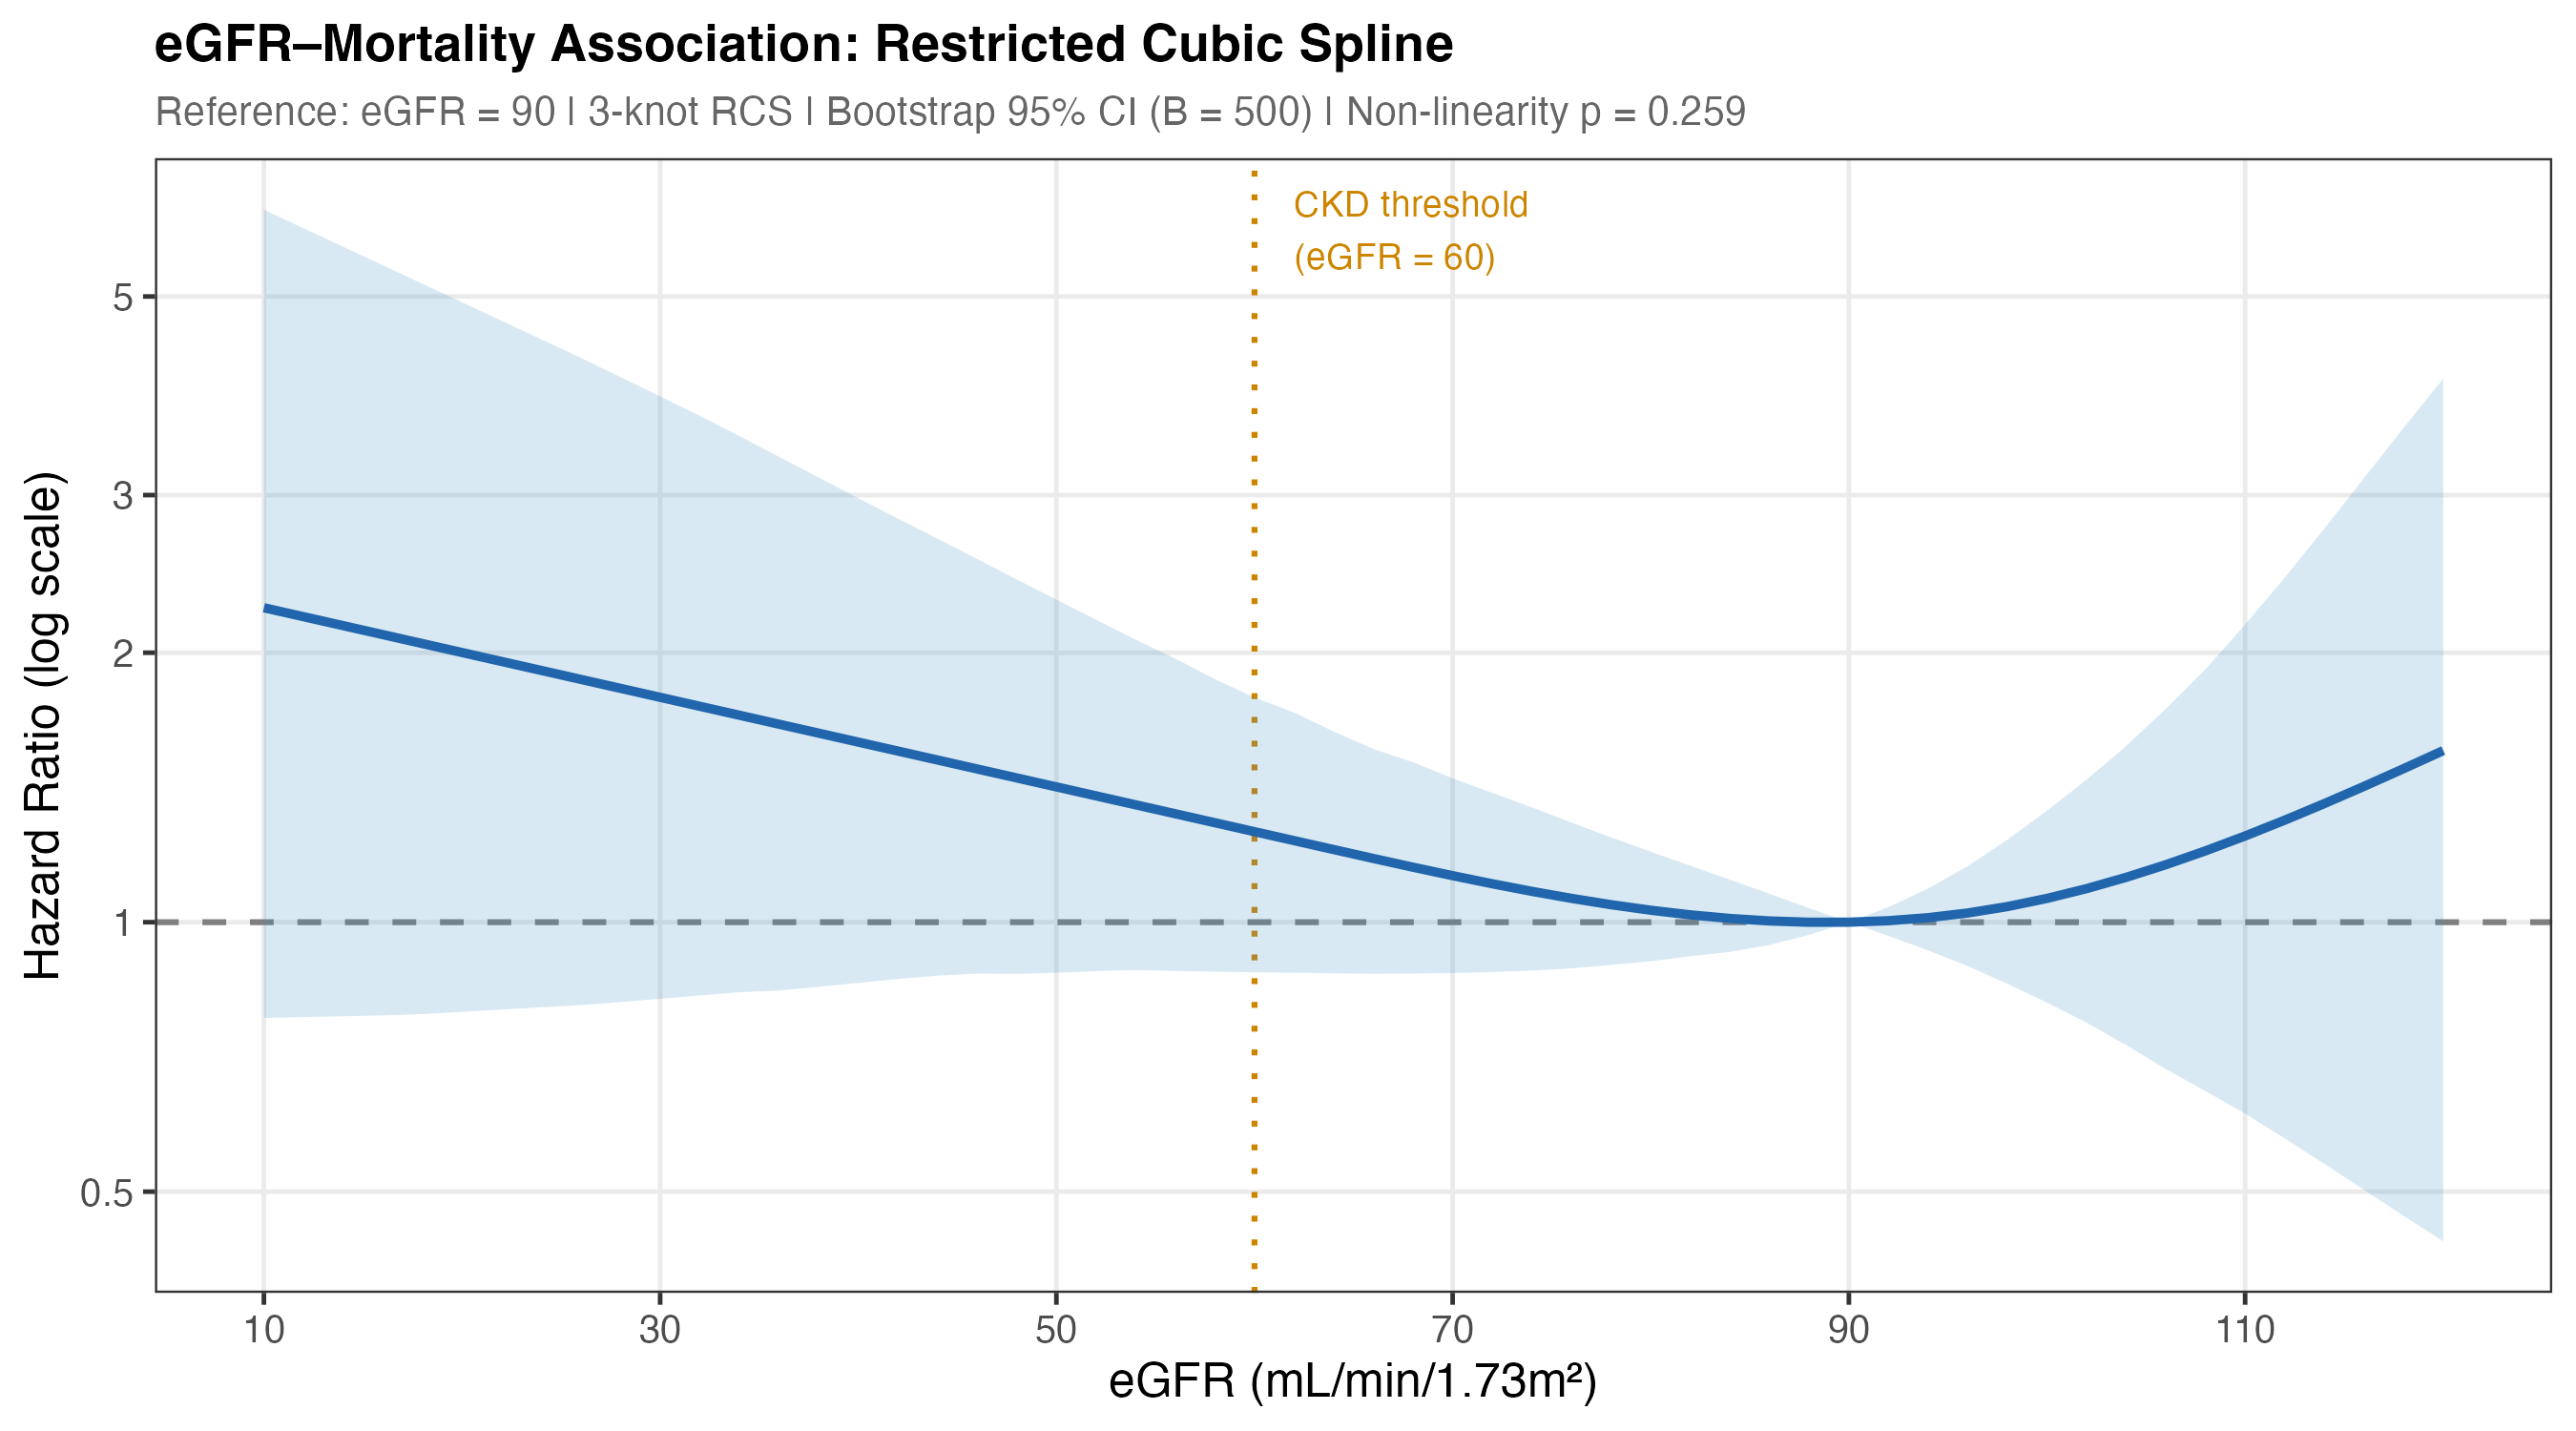
Figure 7. Restricted cubic spline (3 knots) of the eGFR–mortality association. Reference eGFR = 90. Bootstrap 95% CI (B=500). Non-linearity likelihood ratio test p=0.259 — a linear model adequately describes the association over the observed eGFR range.
Discussion
CKD stage is attenuated by comorbidity adjustment
The most striking finding is that CKD G-stage — the primary clinical classification tool — does not independently predict short-term mortality after full multivariable adjustment. Model 1 (CKD stage only) achieved C=0.744, but the C-statistic improvement from Model 1 to Model 2 (adding age, sex, race/ethnicity: +0.089) vastly exceeds the improvement from Model 2 to Model 3 (adding diabetes, income, BMI, lifestyle: +0.014). This confirms that eGFR staging captures mortality risk largely through its correlation with age and comorbid burden — not through an independent pathway.
This does not diminish the clinical value of eGFR staging for monitoring disease progression, guiding treatment thresholds, and predicting ESRD. Rather, it underscores that survival prediction requires a broader multidomain model. These findings align with the CKD Prognosis Consortium literature showing that UACR, rather than eGFR alone, carries important independent prognostic information — consistent with our borderline-significant UACR finding (HR 1.19, p=0.057) that becomes significant (p=0.033) in MI analysis.2
Age and diabetes as equivalent mortality drivers
The identical HRs for age per decade (1.73) and diabetes (1.73) are notable: a diagnosis of diabetes confers the same short-term mortality hazard as 10 additional years of aging. Combined with the multiplicative nature of Cox models, this means that an older diabetic CKD patient faces substantially compounded risk — reinforcing the importance of diabetes management as the primary modifiable intervention target in CKD care.
Economic hardship as the strongest predictor
The below-poverty HR of 2.75 is the largest point estimate in the model — exceeding the effect size of any clinical or behavioral predictor. This structural determinant of health persists after adjusting for lifestyle and clinical factors, reflecting barriers to care access, medication adherence, dietary quality, and chronic stress that cannot be fully captured by behavioral variables. For programs like KECC working with Medicare ESRD populations, income and dual-eligibility status may be as prognostically important as clinical staging.
Study limitations and follow-up considerations
The 2.1-year median follow-up is the primary constraint on these results. CKD-related mortality typically manifests over 5–10+ year horizons; ESRD progression, cardiovascular events, and CKD-stage-specific mortality gradients require longer observation to separate. Future analyses with the USRDS database — covering 3+ million ESRD patients with decade-long follow-up — would be better positioned to characterise stage-specific mortality trajectories.
Limitations
- Short follow-up (2.1 years median). The NHANES mortality linkage file is cut to December 2019, restricting follow-up for J-cycle participants and excluding L-cycle participants entirely. CKD stage-specific mortality gradients (G3–G5) require 5–10+ years to fully manifest. Results should be interpreted as predictors of short-term rather than long-term survival.
- Cross-sectional exposure measurement. NHANES biomarkers (creatinine, HbA1c, UACR) are measured at a single time point. Chronic exposure to reduced eGFR and persistent albuminuria — more relevant for mortality prediction — cannot be captured without repeated measures.
- Questionnaire-based comorbidities. Hypertension and physical activity were derived from self-report questionnaires, subject to recall and social-desirability bias. Accelerometer-based PA and measured blood pressure were available but not fully integrated.
- Sparse G4/G5 strata. Only 45 participants had eGFR <30 (G4–G5), producing unstable Cox estimates with wide confidence intervals. Stage-specific analyses in these advanced-CKD subgroups are underpowered.
- Missing dietary data. UACR and dietary covariates had non-trivial missingness (>15%); complete-case analysis reduces sample from 5,038 to 3,739. Multiple imputation (SA-1) shows broadly consistent results.
- Mortality file does not cover 2020+. Deaths occurring after December 2019 are not captured, meaning COVID-19–related excess mortality in CKD patients (a known vulnerability) is entirely absent from the outcome.
References
- KDIGO CKD Work Group. KDIGO 2024 Clinical Practice Guideline for the Evaluation and Management of Chronic Kidney Disease. Kidney Int. 2024;105(4S):S117–S314. doi:10.1016/j.kint.2023.10.018
- CKD Prognosis Consortium; Matsushita K, et al. Association of estimated GFR and albuminuria with all-cause and cardiovascular mortality. Lancet. 2010;375:2073–2081. doi:10.1016/S0140-6736(10)60674-5
- Inker LA, Eneanya ND, Coresh J, et al. New Creatinine- and Cystatin C–Based Equations to Estimate GFR without Race. N Engl J Med. 2021;385:1737–1749. doi:10.1056/NEJMoa2102953
- Centers for Disease Control and Prevention / NCHS. NHANES 2017–2023. wwwn.cdc.gov/nchs/nhanes
- Chu CD, McCulloch CE, Banerjee T, et al. CKD Awareness Among US Adults by Future Risk of Kidney Failure. Am J Kidney Dis. 2021;76:174–183.
- United States Renal Data System. 2023 USRDS Annual Data Report. National Institutes of Health, NIDDK; Bethesda, MD: 2023.
- van Buuren S, Groothuis-Oudshoorn K. mice: Multivariate Imputation by Chained Equations in R. J Stat Softw. 2011;45(3):1–67.
- Kuhn M, Wickham H. Tidymodels: a collection of packages for modelling and machine learning using tidyverse principles. 2020. tidymodels.org